Daniocell
arid5b (blastomeres)
AT-rich interaction domain 5B
ZFIN
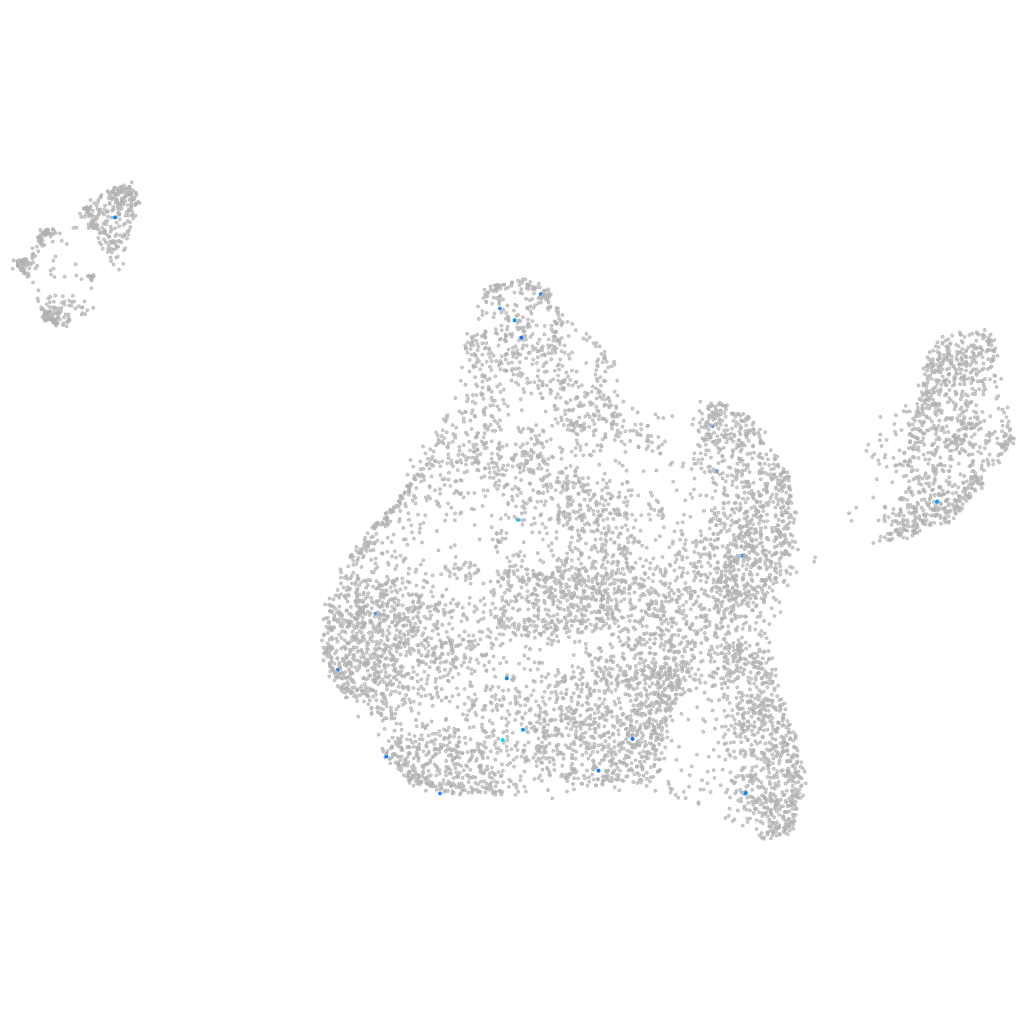
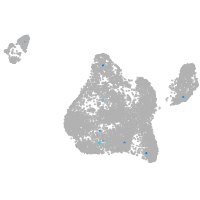
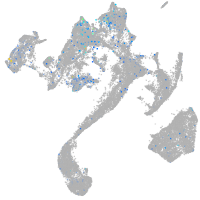
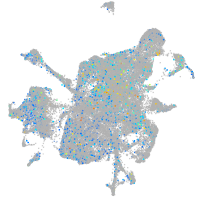
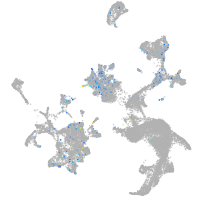
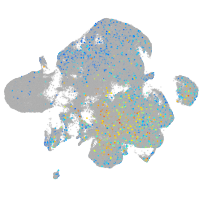
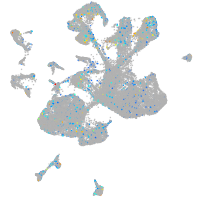
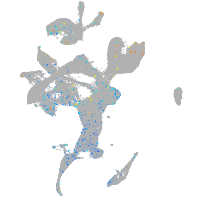
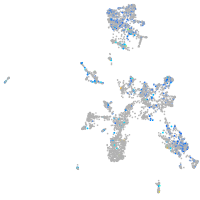
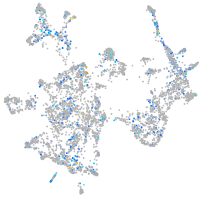
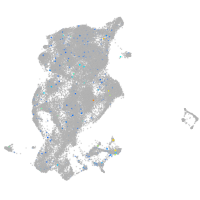
Gene expression UMAP
Display:
Expression
Stage
Other cell groups
all cells
blastomeres
PGCs
endoderm
axial mesoderm
muscle
mural cells /
non-skeletal muscle
mesenchyme
hematopoietic /
vasculature
pronephros
neural
spinal cord / glia
eye
taste / olfactory
otic / lateral line
epidermis
periderm
fin
ionocytes / mucous
pigment cells
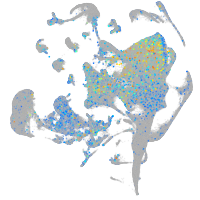
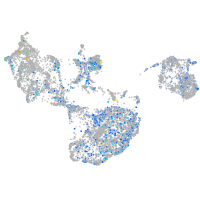
Expression by stage/cluster
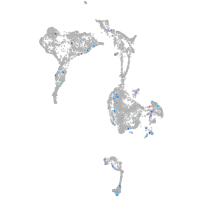
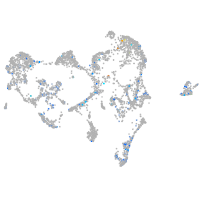
Correlated gene expression
Positive correlation
Negative correlation
Gene
r
Gene
r
CR848791.3
0.258
mphosph6
-0.034
BX546499.2
0.251
ctsla
-0.030
BX537280.1
0.238
polr2l
-0.029
mir459
0.215
FQ323156.1
-0.028
impg1a
0.212
taf13
-0.027
si:ch211-266k8.6
0.211
rbx1
-0.026
si:dkey-23f9.8
0.180
taf15
-0.025
BX908731.1
0.176
golph3
-0.025
BX649398.3
0.174
cirbpa
-0.024
LOC110439804
0.160
polr2f
-0.023
ihhb
0.153
si:ch211-133n4.4
-0.023
slco3a1
0.150
pdia6
-0.023
phka1b
0.150
ppm1g
-0.022
mylpfa
0.149
triqk
-0.022
XLOC-020898
0.148
cdca5
-0.021
XLOC-041832
0.146
pole4
-0.021
ptk2ba
0.144
pole3
-0.021
si:ch211-194g2.4
0.137
si:dkey-48p11.3
-0.021
prokr1b
0.128
si:ch73-308l14.2
-0.021
BX120005.1
0.127
trim33
-0.021
XLOC-020079
0.124
mlx
-0.021
mir142a
0.124
n6amt1
-0.021
RF00093
0.122
cx43.4
-0.021
LOC110437982
0.121
ppp1r2
-0.020
RIMS2
0.120
zp3d.1
-0.020
hoxd4a
0.118
glg1a
-0.020
cetp
0.116
mibp
-0.020
zgc:153031
0.114
gclm
-0.020
si:ch1073-398f15.1
0.110
shisa2a
-0.020
zgc:172341
0.108
smc1al
-0.020
si:dkey-253d23.3
0.108
slc38a7
-0.020
zmp:0000001289
0.107
serbp1b
-0.020
LOC103910100
0.106
cul1b
-0.020
calcrla
0.106
zgc:163030
-0.019
si:ch73-28h20.1
0.106
ier5
-0.019