Daniocell
arhgap35a (pigment cells)
Rho GTPase activating protein 35a
ZFIN
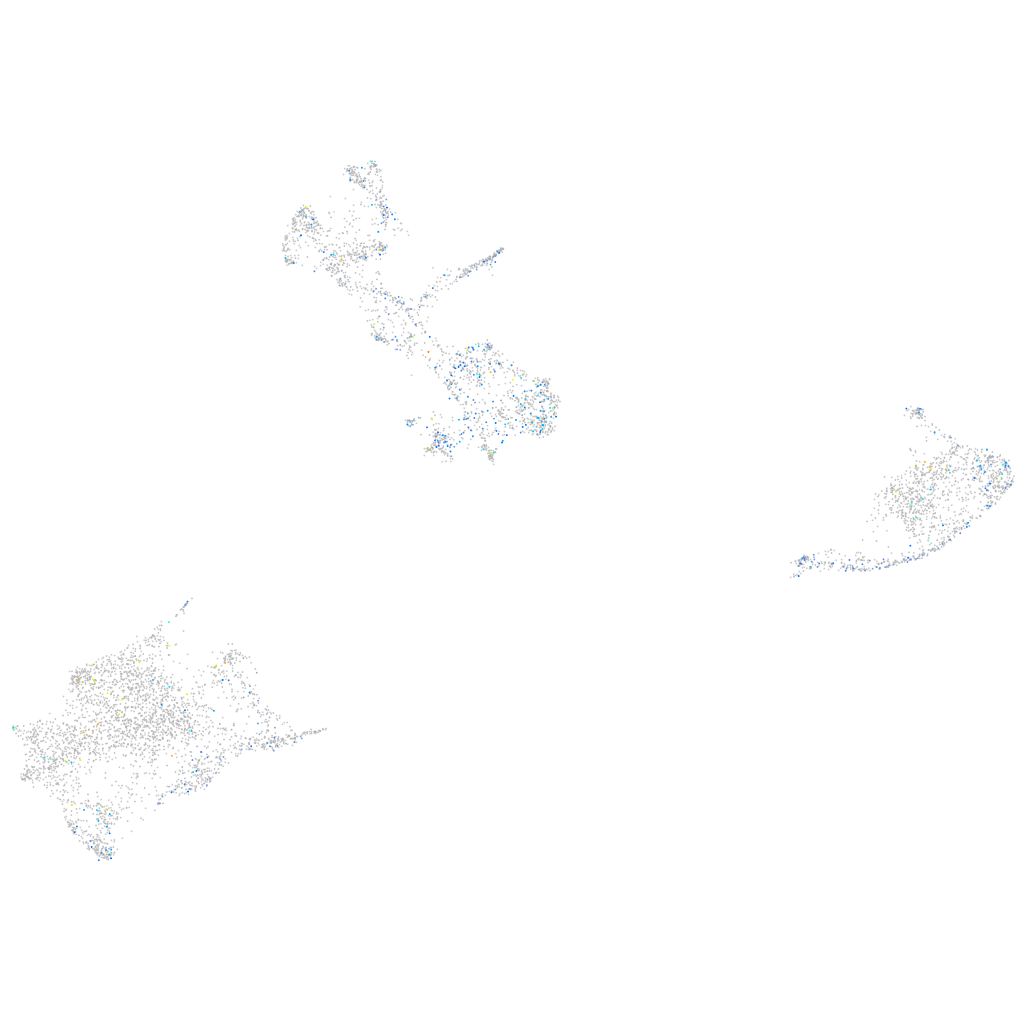
Gene expression UMAP
Display:
Expression
Stage
Other cell groups
all cells
blastomeres
PGCs
endoderm
axial mesoderm
muscle
mural cells /
non-skeletal muscle
mesenchyme
hematopoietic /
vasculature
pronephros
neural
spinal cord / glia
eye
taste / olfactory
otic / lateral line
epidermis
periderm
fin
ionocytes / mucous
pigment cells
Expression by stage/cluster
Correlated gene expression
Positive correlation
Negative correlation
Gene
r
Gene
r
si:dkeyp-79b7.12
0.116
gstp1
-0.080
si:ch73-1a9.3
0.113
uraha
-0.072
zgc:165555.2
0.113
pts
-0.069
XLOC-034430
0.111
akr1b1
-0.068
LOC103909553
0.110
gch2
-0.067
nova2
0.109
mdh1aa
-0.066
hist1h2a4.1
0.107
slc22a7a
-0.064
LOC557811
0.107
si:dkey-251i10.2
-0.061
fhdc5
0.106
gpd1b
-0.061
trim33
0.103
paics
-0.061
cd109
0.103
bscl2l
-0.061
si:ch211-286b5.2
0.102
bco1
-0.059
si:ch211-288g17.3
0.102
zgc:110339
-0.058
nucks1a
0.102
CABZ01021592.1
-0.057
LOC110439474
0.102
aox5
-0.057
LOC110439198
0.101
tmem130
-0.056
FO904970.1
0.100
reep5
-0.054
hmgb1a
0.099
phyhd1
-0.054
gnao1a
0.098
impdh1b
-0.053
RIMS2
0.098
slc2a15a
-0.053
si:dkey-26i13.7
0.098
slc2a11b
-0.050
epb41a
0.098
cyb5a
-0.049
chd4a
0.097
prdx1
-0.047
rnasekb
0.097
glulb
-0.046
tox
0.096
prdx5
-0.043
CR847534.1
0.096
sprb
-0.043
slc1a9
0.096
zgc:113337
-0.042
si:dkey-28o19.1
0.095
sult1st1
-0.042
ptmab
0.095
idh1
-0.042
myt1b
0.094
sigmar1
-0.041
khdrbs1a
0.094
aclya
-0.040
ptmaa
0.093
actb2
-0.040
foxp4
0.093
aldob
-0.040
CR774179.2
0.093
si:dkey-151g10.6
-0.037
nsg2
0.093
pfn1
-0.037