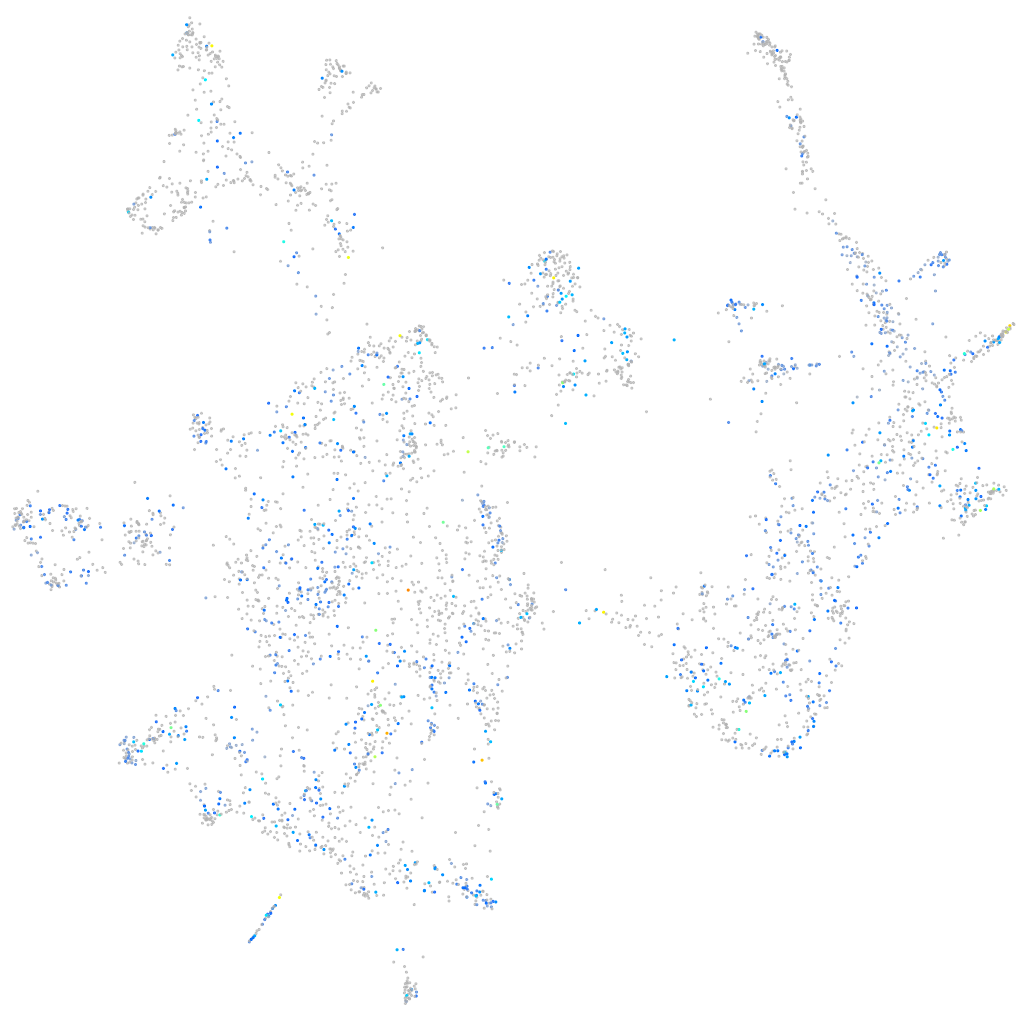
Daniocell
arhgap35a (otic / lateral line)
Rho GTPase activating protein 35a
ZFIN
Gene expression UMAP
Display:
Expression
Stage
Other cell groups
all cells
blastomeres
PGCs
endoderm
axial mesoderm
muscle
mural cells /
non-skeletal muscle
mesenchyme
hematopoietic /
vasculature
pronephros
neural
spinal cord / glia
eye
taste / olfactory
otic / lateral line
epidermis
periderm
fin
ionocytes / mucous
pigment cells
Expression by stage/cluster
Correlated gene expression
Positive correlation
Negative correlation
Gene
r
Gene
r
col4a5
0.119
calml4a
-0.101
epcam
0.112
gpx1b
-0.101
ahnak
0.111
nptna
-0.098
LOC101882062
0.109
CR925719.1
-0.097
hspb8
0.108
daw1
-0.096
LOC101884182
0.104
si:ch73-15n15.3
-0.094
cldnb
0.103
atp1a3b
-0.094
zfhx3
0.100
eno1a
-0.093
cav2
0.098
gb:eh456644
-0.092
XLOC-025566
0.098
otofb
-0.092
xbp1
0.098
emb
-0.092
pitpnm3
0.096
gpx2
-0.092
mpzl2b
0.096
gipc3
-0.091
btg2
0.096
si:ch211-243g18.2
-0.090
sec61a1
0.095
lmo7b
-0.089
XLOC-031005
0.095
tspan13b
-0.089
itm2bb
0.095
odf3l2a
-0.089
XLOC-019975
0.094
erich3
-0.088
si:dkeyp-26a9.7
0.094
enkur
-0.088
traf2a
0.094
dnajc5b
-0.087
arhgef18a
0.093
si:ch211-147d7.5
-0.087
cdh1
0.091
cd164l2
-0.087
socs3a
0.091
anxa5a
-0.087
foxp4
0.091
osbpl1a
-0.087
CABZ01040999.1
0.091
cabp2b
-0.085
si:ch211-198g14.2
0.091
hsd17b7
-0.085
LOC108182785
0.090
kifl
-0.084
si:ch211-39i22.1
0.090
lrrc73
-0.084
marcksl1b
0.090
meig1
-0.084
trim63b
0.089
bdnf
-0.084
col4a6
0.089
myo15ab
-0.083
LOC103911705
0.087
si:ch211-57i17.5
-0.083
tnks1bp1
0.086
tekt3
-0.083
XLOC-044191
0.086
vsig10l2
-0.082
CR383676.1
0.086
grxcr2
-0.082