Daniocell
arfgap1 (blastomeres)
ADP-ribosylation factor GTPase activating protein 1
ZFIN
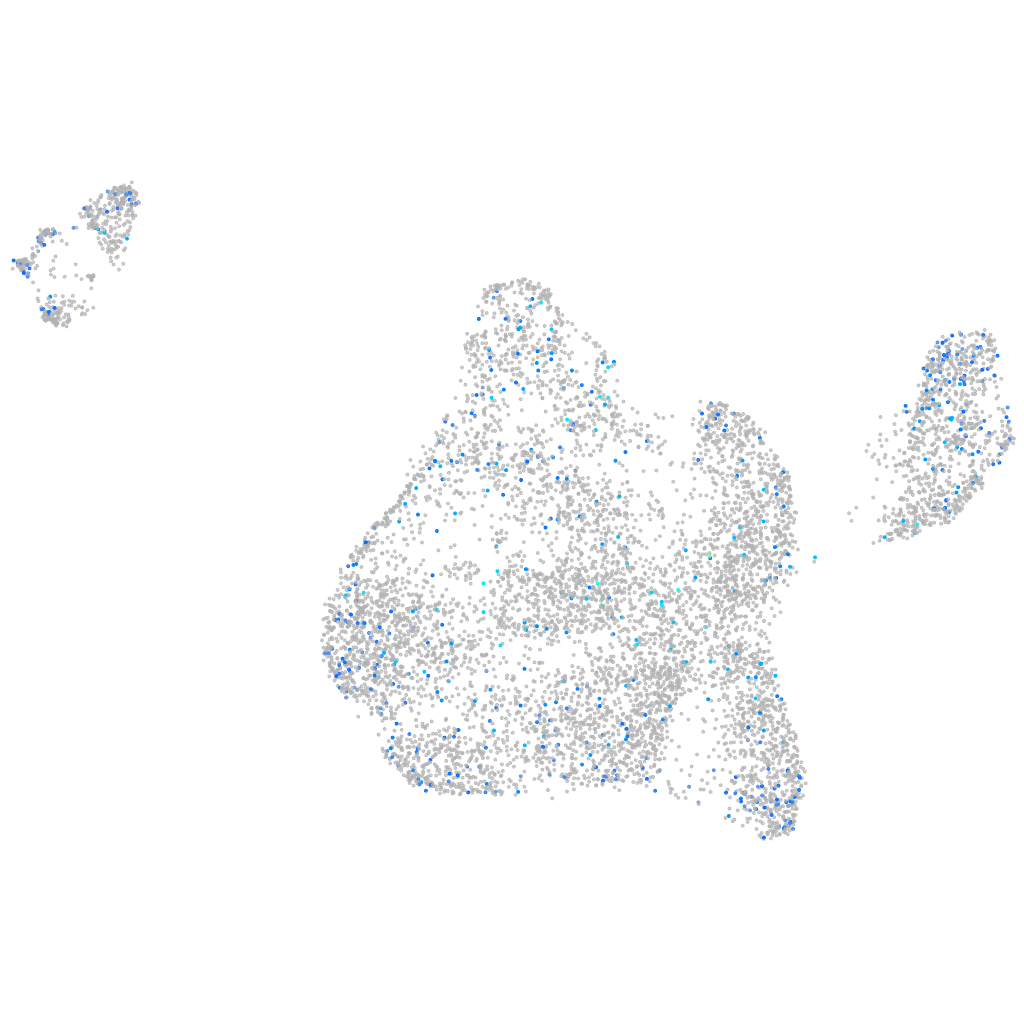
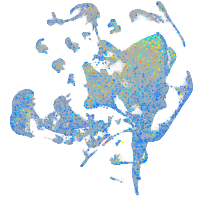
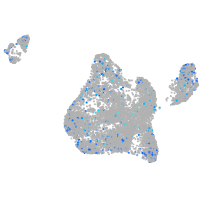
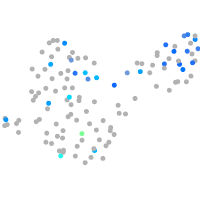
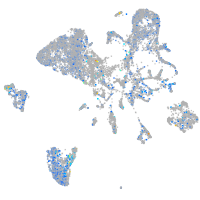
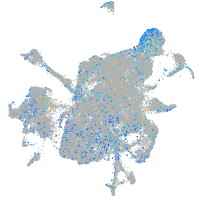
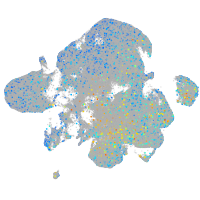
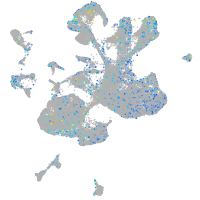
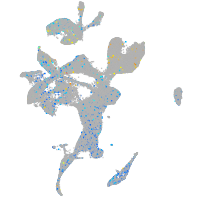
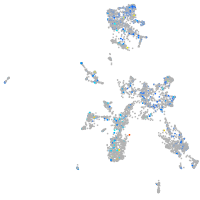
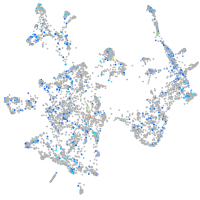
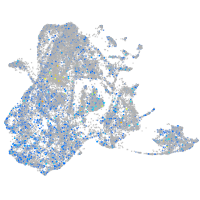
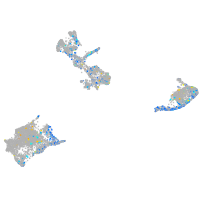
Gene expression UMAP
Display:
Expression
Stage
Other cell groups
all cells
blastomeres
PGCs
endoderm
axial mesoderm
muscle
mural cells /
non-skeletal muscle
mesenchyme
hematopoietic /
vasculature
pronephros
neural
spinal cord / glia
eye
taste / olfactory
otic / lateral line
epidermis
periderm
fin
ionocytes / mucous
pigment cells
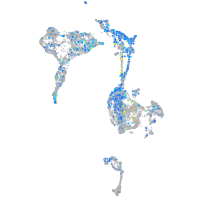
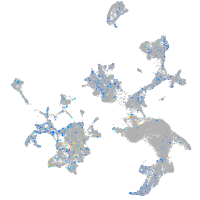
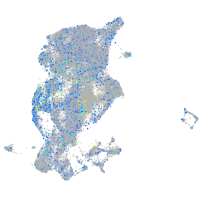
Expression by stage/cluster
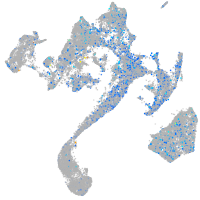
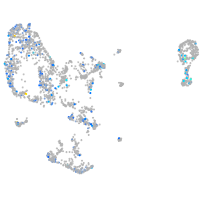
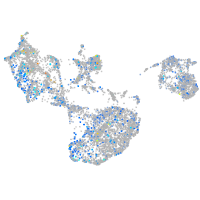
Correlated gene expression
Positive correlation
Negative correlation
Gene
r
Gene
r
cxcl8b.3
0.077
NC-002333.4
-0.049
RF00016
0.072
si:ch211-222l21.1
-0.032
ftr04
0.071
si:ch211-152c2.3
-0.032
LOC110438870
0.070
hmgb2a
-0.032
gabrr2a
0.069
aldob
-0.030
spns3
0.068
si:ch211-262h13.3
-0.029
si:dkeyp-80d11.10
0.068
zgc:114118
-0.028
LOC101882453
0.067
rplp0
-0.028
XLOC-008101
0.065
szl
-0.028
foxo1a
0.065
smad1
-0.028
arap1
0.064
rangap1a
-0.028
si:ch211-135f11.6
0.064
znf800a
-0.028
AL935334.1
0.063
oga
-0.027
CU104743.1
0.063
hmgn6
-0.027
LOC101883268
0.063
CR383676.2
-0.027
mir19d
0.062
eif3s6ip
-0.026
prss12
0.062
ccdc85b
-0.026
XLOC-014477
0.062
XLOC-004018
-0.026
rxrga
0.061
rtca
-0.025
il1fma
0.061
flot2a
-0.025
LOC103911506
0.061
pou5f3
-0.025
zgc:110789
0.061
abracl
-0.025
LOC110437842
0.059
snrpb
-0.025
zmp:0000000650
0.059
srp9
-0.025
scpp9
0.059
carhsp1
-0.025
elovl8a
0.059
fzd2
-0.025
lrrc3ca
0.058
sox3
-0.024
zgc:111983
0.058
hspb1
-0.024
si:ch211-193l2.10
0.058
nova2
-0.024
fer1l4
0.057
rps6
-0.024
LOC100006926
0.056
lyrm4
-0.024
trarg1b
0.056
rpp40
-0.024
ube2d2
0.056
e2f1
-0.024
si:ch211-66i15.4
0.056
znhit2
-0.024
si:ch73-375g18.1
0.056
nfil3-5
-0.023