Daniocell
anxa2b (muscle)
annexin A2b
ZFIN
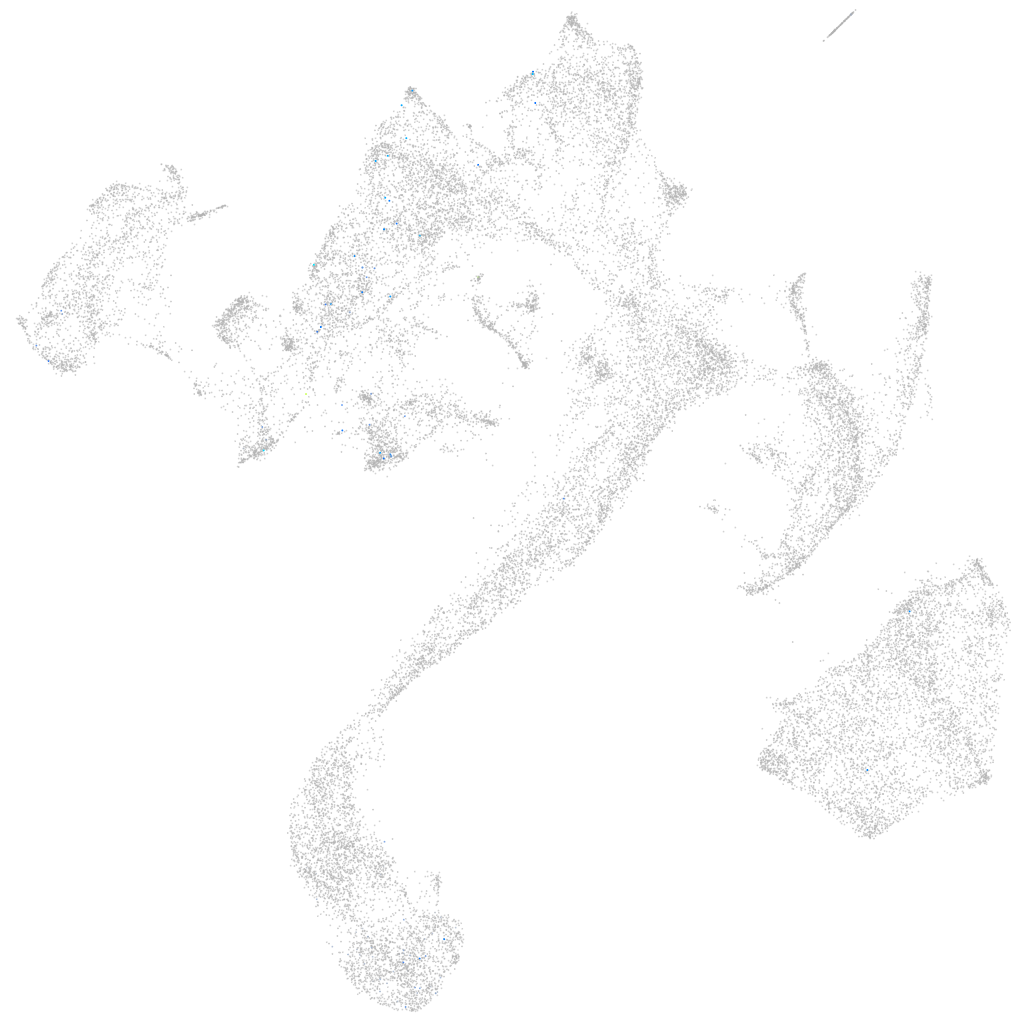
Gene expression UMAP
Display:
Expression
Stage
Other cell groups
all cells
blastomeres
PGCs
endoderm
axial mesoderm
muscle
mural cells /
non-skeletal muscle
mesenchyme
hematopoietic /
vasculature
pronephros
neural
spinal cord / glia
eye
taste / olfactory
otic / lateral line
epidermis
periderm
fin
ionocytes / mucous
pigment cells
Expression by stage/cluster
Correlated gene expression
Positive correlation
Negative correlation
Gene
r
Gene
r
neto2b
0.244
ptges3b
-0.037
cx32.2
0.185
snrpb
-0.036
LOC108190565
0.181
qkia
-0.033
XLOC-012822
0.172
hnrnpaba
-0.032
aqp8a.2
0.144
hmga1a
-0.032
nectin4b
0.139
hmgn6
-0.032
jak3
0.139
ddx39ab
-0.032
si:ch211-156p11.1
0.125
nop58
-0.032
LOC558761
0.125
eif2s2
-0.030
nkpd1
0.124
acin1a
-0.030
XLOC-008303
0.123
serbp1a
-0.030
casr
0.114
lsm12b
-0.030
CABZ01065417.1
0.112
syncrip
-0.030
lgals2b
0.111
hnrnph1l
-0.030
CR391991.3
0.110
ebna1bp2
-0.030
CABZ01074470.1
0.108
smarce1
-0.029
CT583726.1
0.106
arf5
-0.028
si:dkey-188i13.6
0.099
npm1a
-0.028
ddr2b
0.099
snrpf
-0.028
LOC572443
0.097
hspb1
-0.028
si:ch211-284e13.9
0.097
api5
-0.028
pimr203
0.097
cirbpb
-0.027
pimr205
0.097
si:ch73-281n10.2
-0.027
CR854980.1
0.095
snrpd2
-0.027
wu:fj19g03
0.094
nucks1a
-0.027
LOC101886340
0.093
nhp2
-0.027
BX470218.1
0.092
marcksb
-0.027
CR384085.1
0.091
srsf1a
-0.026
ccl25a
0.091
gspt1l
-0.026
si:dkey-36i7.3
0.091
ammecr1
-0.026
ahsg2
0.090
asph
-0.026
tm4sf4
0.089
zgc:86598
-0.026
antxr1d
0.085
h2afvb
-0.026
chrnb2b
0.084
hp1bp3
-0.026
kcne4
0.084
khdrbs1a
-0.026