Daniocell
anxa2b (eye)
annexin A2b
ZFIN
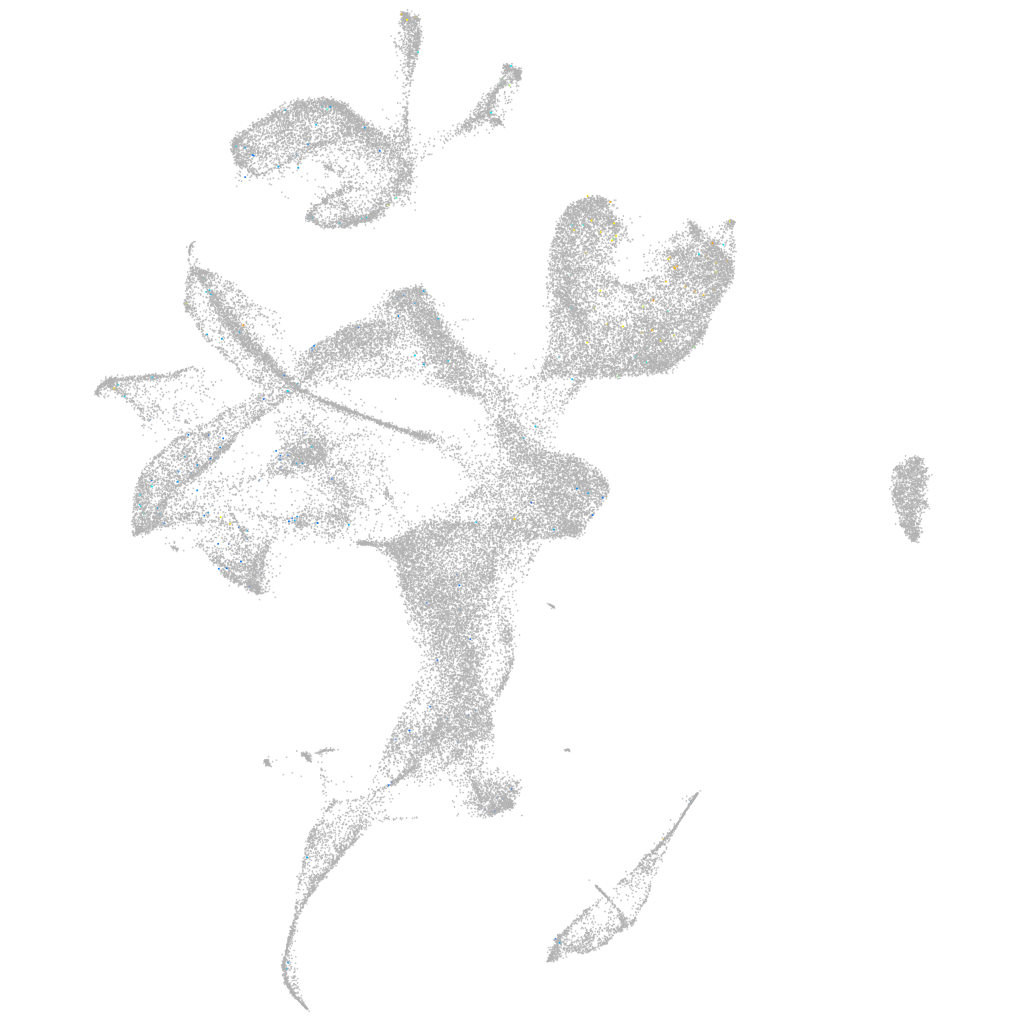
Gene expression UMAP
Display:
Expression
Stage
Other cell groups
all cells
blastomeres
PGCs
endoderm
axial mesoderm
muscle
mural cells /
non-skeletal muscle
mesenchyme
hematopoietic /
vasculature
pronephros
neural
spinal cord / glia
eye
taste / olfactory
otic / lateral line
epidermis
periderm
fin
ionocytes / mucous
pigment cells
Expression by stage/cluster
Correlated gene expression
Positive correlation
Negative correlation
Gene
r
Gene
r
si:dkey-11o1.7
0.098
rpl32
-0.046
si:dkey-61f9.2
0.074
rpl3
-0.038
si:dkey-19c16.12
0.073
rpl5b
-0.037
b4galnt1a
0.068
rpl18a
-0.037
si:dkey-163m14.6
0.066
rpl23a
-0.036
LOC110438228
0.066
rps28
-0.036
AL954149.2
0.065
rps12
-0.036
BX663605.1
0.065
uba52
-0.035
LOC108190132
0.065
rpl14
-0.035
gpx2
0.060
rpl8
-0.035
LOC103910163
0.060
rps16
-0.034
maats1
0.059
rps8a
-0.034
FP016247.2
0.059
rps9
-0.034
si:ch211-214j8.1
0.059
hmga1a
-0.034
otol1b
0.058
rpl35a
-0.034
si:ch73-256j6.3
0.057
rpl35
-0.034
acp5b
0.056
rps11
-0.034
gbgt1l1
0.055
rpl17
-0.033
si:dkey-242g16.2
0.054
rpl22l1
-0.033
nitr13
0.053
rps29
-0.033
anpepa
0.053
rpl15
-0.033
LOC110438555
0.052
rps27a
-0.033
LOC103910840
0.052
rps13
-0.033
itih3a
0.051
rps6
-0.033
XLOC-033023
0.051
rpl24
-0.033
XLOC-007977
0.049
si:dkey-151g10.6
-0.033
eps8l3b
0.049
rplp0
-0.033
duox
0.048
rpl26
-0.032
si:ch211-149a19.3
0.048
seta
-0.032
LOC110439448
0.047
tpt1
-0.032
LOC567909
0.046
rps3
-0.032
flnca
0.044
rpl36
-0.032
CR376774.1
0.044
hmgb2b
-0.032
anpepb
0.044
ppiaa
-0.032
CU861459.1
0.043
rps24
-0.032