
annexin A11a
ZFIN 
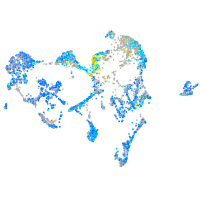
Gene expression UMAP


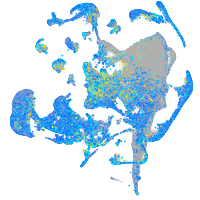
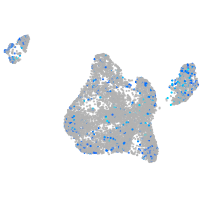
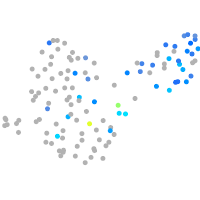

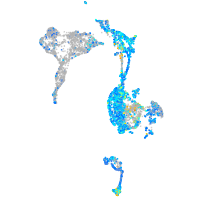
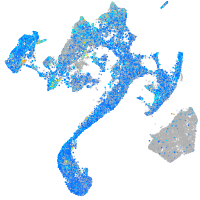
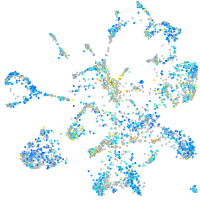
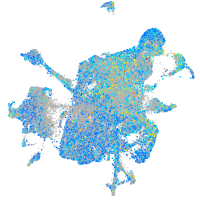

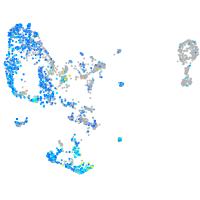
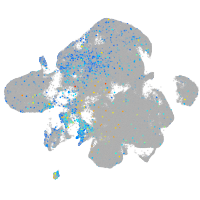


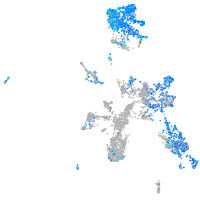

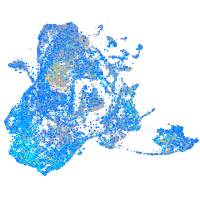

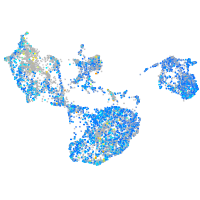

Expression by stage/cluster
Correlated gene expression
| Positive correlation | Negative correlation | ||
| Gene | r | Gene | r |
| anxa13 | 0.215 | elavl3 | -0.184 |
| cnn2 | 0.211 | ptmab | -0.168 |
| fabp7a | 0.203 | si:ch211-222l21.1 | -0.150 |
| anxa4 | 0.201 | myt1b | -0.143 |
| anxa11b | 0.186 | hmgb3a | -0.135 |
| tgfb3 | 0.183 | h3f3d | -0.135 |
| efhd1 | 0.183 | sox11b | -0.130 |
| gnai2a | 0.182 | tubb2b | -0.127 |
| ppap2d | 0.181 | si:ch73-386h18.1 | -0.127 |
| sparc | 0.179 | tmsb | -0.126 |
| cdo1 | 0.177 | tubb5 | -0.123 |
| slc3a2a | 0.174 | myt1a | -0.121 |
| hepacama | 0.173 | si:ch211-288g17.3 | -0.120 |
| sept10 | 0.170 | h3f3a | -0.117 |
| glula | 0.170 | cirbpb | -0.117 |
| atp1b1a | 0.169 | hnrnpaba | -0.117 |
| si:dkey-7j14.6 | 0.169 | si:dkey-276j7.1 | -0.115 |
| igfbp7 | 0.169 | nova2 | -0.115 |
| si:ch1073-303k11.2 | 0.166 | si:ch211-57n23.4 | -0.114 |
| rpz5 | 0.166 | ptmaa | -0.111 |
| slc1a2b | 0.164 | chd4a | -0.110 |
| npc2 | 0.163 | marcksb | -0.108 |
| krt18a.1 | 0.160 | zc4h2 | -0.106 |
| cx43 | 0.160 | epb41a | -0.106 |
| cavin2a | 0.160 | si:ch73-1a9.3 | -0.106 |
| cavin2b | 0.160 | fabp3 | -0.105 |
| si:ch211-66e2.5 | 0.159 | mex3b | -0.105 |
| qki2 | 0.159 | gng2 | -0.105 |
| cd63 | 0.159 | stxbp1a | -0.105 |
| ptn | 0.159 | hmga1a | -0.104 |
| krt8 | 0.159 | stmn1b | -0.103 |
| cyp2ad3 | 0.158 | tmeff1b | -0.103 |
| GCA | 0.158 | tp53inp2 | -0.103 |
| ssuh2rs1 | 0.157 | hnrnpa0l | -0.103 |
| atp1a1b | 0.157 | zfhx3 | -0.102 |