Daniocell
ano5b (periderm)
anoctamin 5b
ZFIN
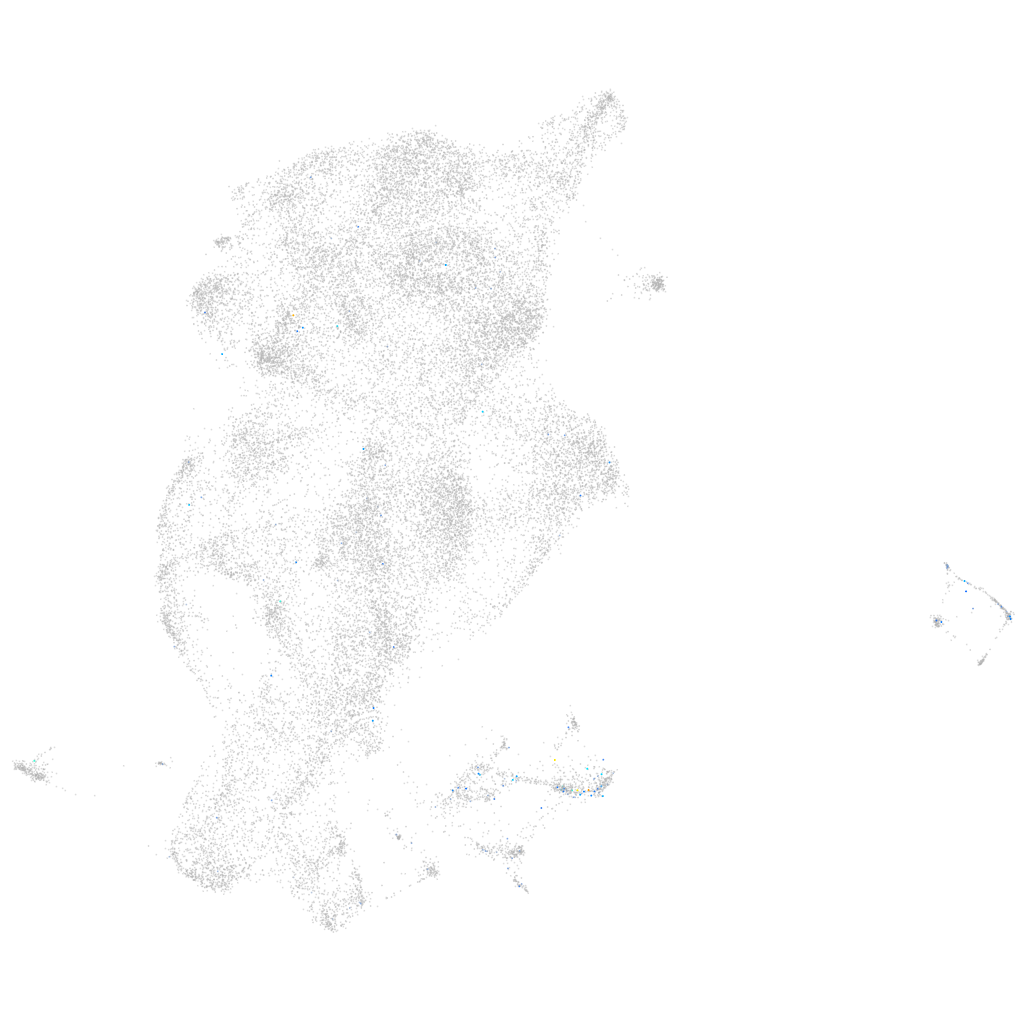
Gene expression UMAP
Display:
Expression
Stage
Other cell groups
all cells
blastomeres
PGCs
endoderm
axial mesoderm
muscle
mural cells /
non-skeletal muscle
mesenchyme
hematopoietic /
vasculature
pronephros
neural
spinal cord / glia
eye
taste / olfactory
otic / lateral line
epidermis
periderm
fin
ionocytes / mucous
pigment cells
Expression by stage/cluster
Correlated gene expression
Positive correlation
Negative correlation
Gene
r
Gene
r
CR847537.1
0.198
cyt1
-0.067
cldn20
0.194
icn2
-0.067
gpr176
0.191
wu:fb18f06
-0.057
or111-7
0.185
si:ch211-195b11.3
-0.056
BX005392.1
0.182
krt4
-0.052
si:ch211-197n1.2
0.180
cfl1l
-0.049
CU633999.2
0.175
agr1
-0.048
XLOC-034498
0.166
anxa1c
-0.048
dchs1a
0.155
icn
-0.047
zp2l2
0.153
cyt1l
-0.046
kiss1
0.153
pycard
-0.041
gabra2a
0.151
mgst1.2
-0.041
glrbb
0.151
scel
-0.041
lrguk
0.150
selenow1
-0.040
grin2da
0.150
zgc:193505
-0.038
si:ch211-106h4.6
0.149
si:ch73-52f15.5
-0.038
LOC110438508
0.146
cst14b.1
-0.038
CR847968.1
0.142
aldob
-0.038
tspan18b
0.140
ckap4
-0.037
her8.2
0.137
anxa1a
-0.037
CABZ01043166.1
0.136
zgc:175088
-0.037
pcdh2g10
0.136
s100w
-0.036
emp3b
0.135
si:dkey-184p9.7
-0.036
mhc1uka
0.132
capns1a
-0.035
elfn2a
0.131
slc38a5b
-0.033
dzip1l
0.131
s100a10b
-0.033
zgc:73226
0.129
krt5
-0.033
zmat4b
0.129
s100v2
-0.033
zeb2b
0.128
hdlbpa
-0.033
pcdh2ab5
0.127
si:dkey-222n6.2
-0.032
CABZ01067581.1
0.126
rpl26
-0.032
kcnk3a
0.125
zgc:163030
-0.032
csdc2a
0.124
tob1b
-0.032
lgi1a
0.124
hrc
-0.031
kirrel1b
0.123
rps10
-0.030