Daniocell
angel2 (taste / olfactory)
angel homolog 2 (Drosophila)
ZFIN
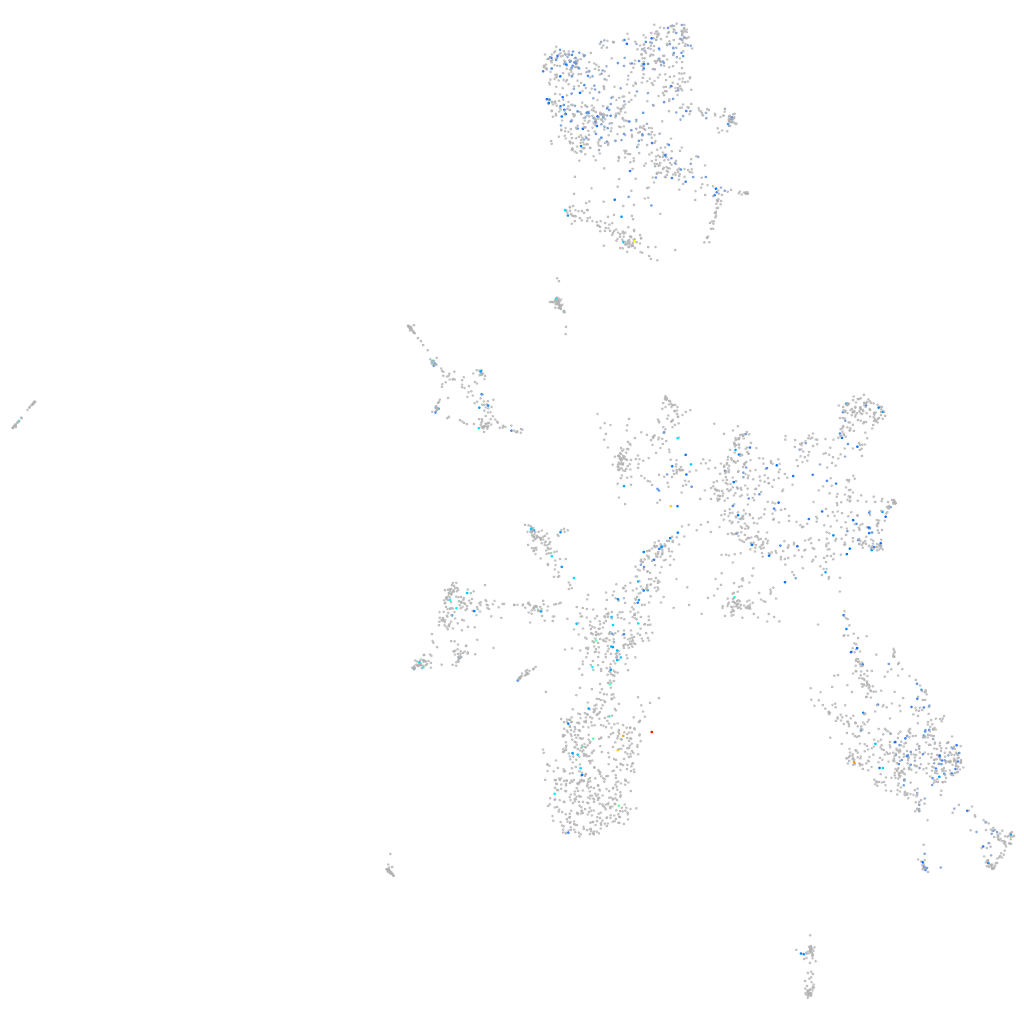
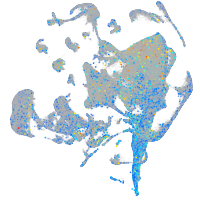
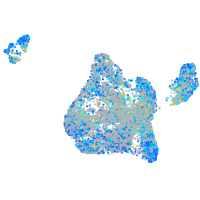
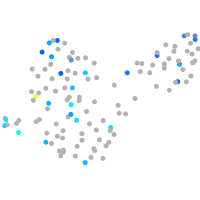
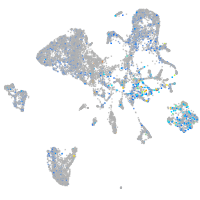
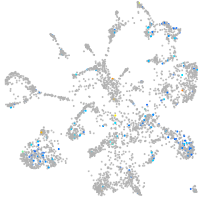
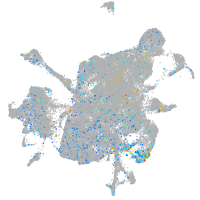
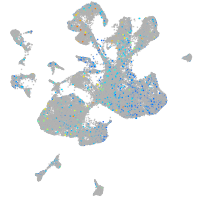
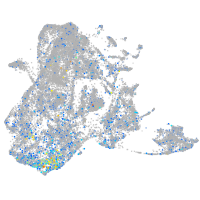
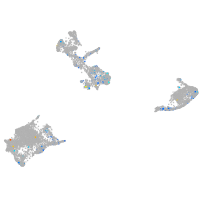
Gene expression UMAP
Display:
Expression
Stage
Other cell groups
all cells
blastomeres
PGCs
endoderm
axial mesoderm
muscle
mural cells /
non-skeletal muscle
mesenchyme
hematopoietic /
vasculature
pronephros
neural
spinal cord / glia
eye
taste / olfactory
otic / lateral line
epidermis
periderm
fin
ionocytes / mucous
pigment cells
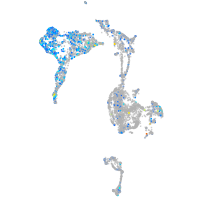
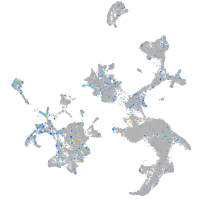
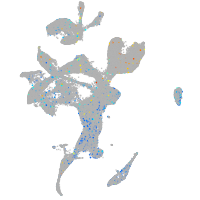
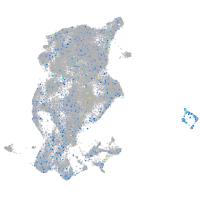
Expression by stage/cluster
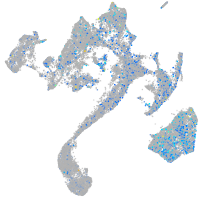
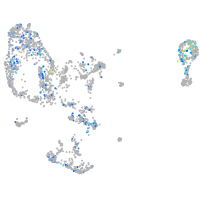
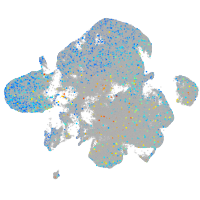
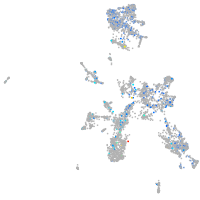
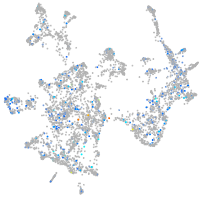
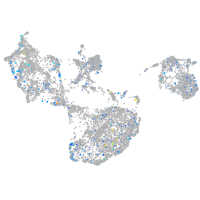
Correlated gene expression
Positive correlation
Negative correlation
Gene
r
Gene
r
zmp:0000000912
0.235
hbbe1.3
-0.065
XLOC-016803
0.235
hbbe1.1
-0.058
CR556709.1
0.204
soul2
-0.054
foxe3
0.198
cyth4a
-0.049
pth2r
0.180
hbae3
-0.047
zmp:0000000937
0.164
ndufc2
-0.047
XLOC-043935
0.159
rasd3
-0.045
asip1
0.155
ttn.2
-0.045
lmod3
0.155
gngt2b
-0.044
bfb
0.149
asb8
-0.044
CR354610.1
0.144
hbbe1.2
-0.043
AL645792.2
0.137
hbae1.1
-0.043
LOC101885611
0.136
rgs7bpa
-0.041
mylk2
0.133
klc3
-0.041
crygm2d16
0.133
rab6ba
-0.041
hoxa13a
0.132
dcun1d3
-0.041
si:dkey-211g8.8
0.130
si:dkey-184p9.7
-0.041
LOC101885256
0.124
cnga4
-0.041
XLOC-003052
0.124
efcab11
-0.040
CABZ01054965.1
0.120
camk2d2
-0.040
nacc1b
0.120
efcab2
-0.040
zc3h7ba
0.118
tnni2a.4
-0.040
LOC101883251
0.115
col1a2
-0.040
pla1a
0.114
cyt1
-0.039
si:dkeyp-41f9.4
0.113
zgc:77439
-0.039
caln1
0.112
mpc2
-0.039
taar19o
0.112
pvalb1
-0.038
CR388373.2
0.111
scamp5a
-0.038
tlr18
0.111
insm1b
-0.038
si:dkey-269i1.4
0.110
opn1sw1
-0.038
arfip2b
0.109
si:dkey-169i5.4
-0.038
hoxc11b
0.108
got1
-0.038
si:ch211-1a19.2
0.107
si:dkey-16p21.8
-0.037
CABZ01065131.1
0.106
dock3
-0.037
oard1
0.105
tcea2
-0.037