Daniocell
alms1 (ionocytes / mucous-producing)
ALMS1 centrosome and basal body associated protein
ZFIN
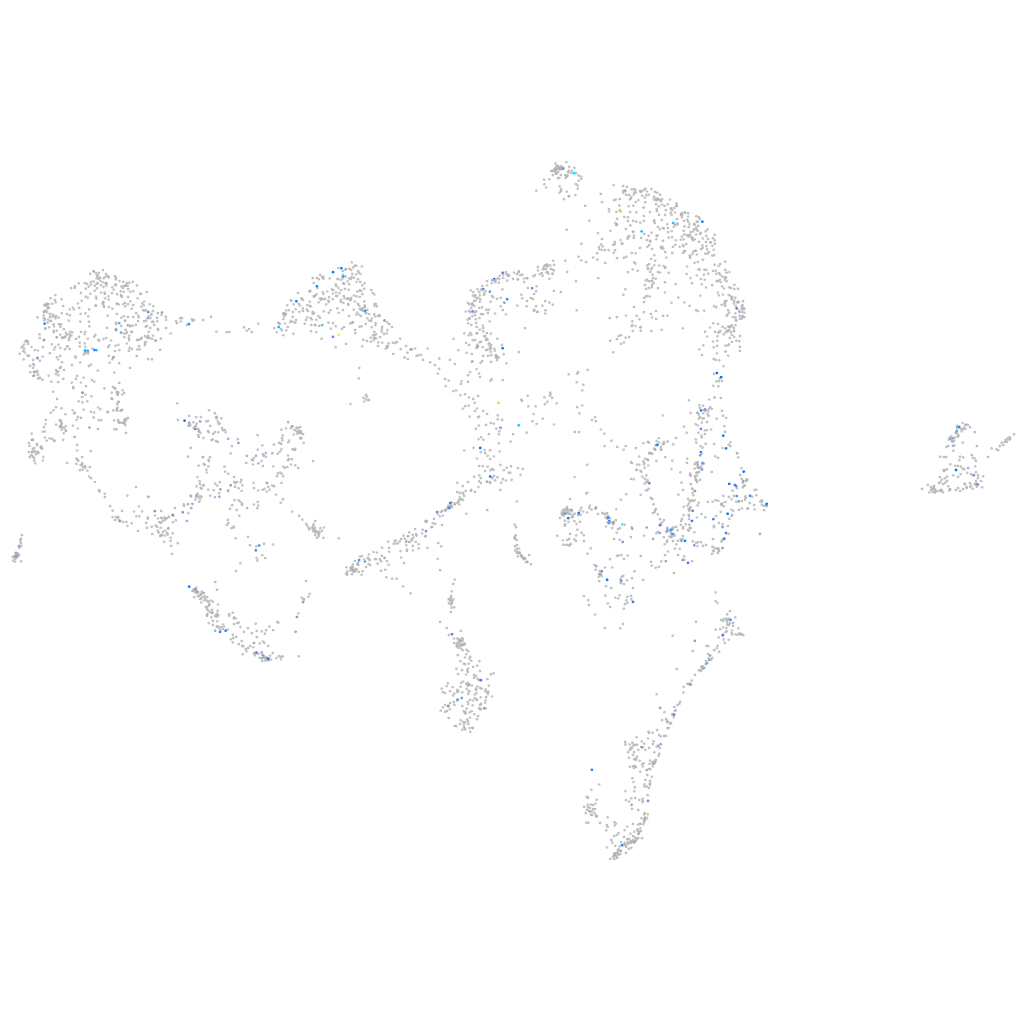
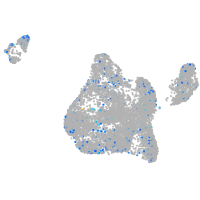
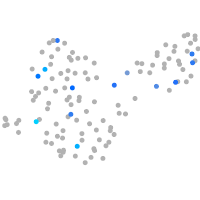
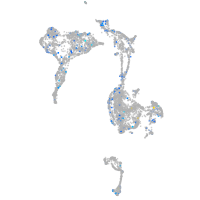
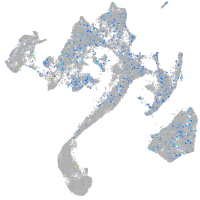
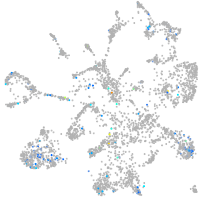
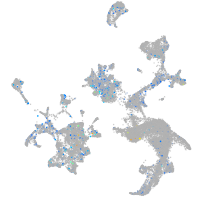
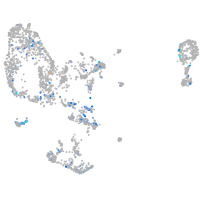
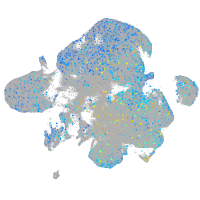
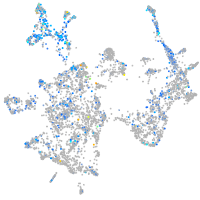
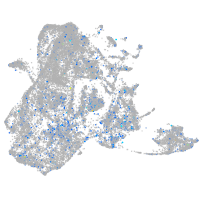
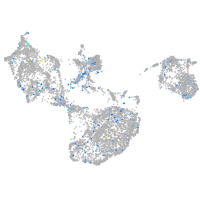
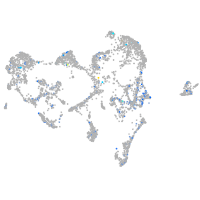
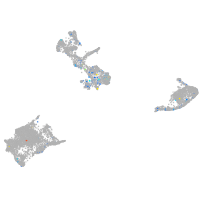
Gene expression UMAP
Display:
Expression
Stage
Other cell groups
all cells
blastomeres
PGCs
endoderm
axial mesoderm
muscle
mural cells /
non-skeletal muscle
mesenchyme
hematopoietic /
vasculature
pronephros
neural
spinal cord / glia
eye
taste / olfactory
otic / lateral line
epidermis
periderm
fin
ionocytes / mucous
pigment cells
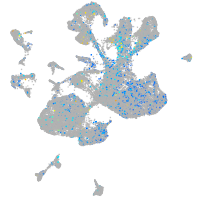
Expression by stage/cluster
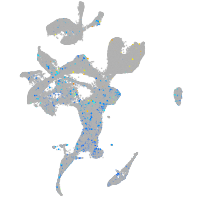
Correlated gene expression
Positive correlation
Negative correlation
Gene
r
Gene
r
CU074419.1
0.256
zgc:153284
-0.061
XLOC-024828
0.184
krt5
-0.056
CR339041.2
0.180
zgc:193505
-0.053
krt95
0.177
ccdc125
-0.050
si:dkey-102c8.2
0.172
hrc
-0.050
LO018011.1
0.169
calr
-0.050
si:dkey-231j24.3
0.169
rpz5
-0.050
cryba1l2
0.167
nansb
-0.049
kcnk7
0.160
slc46a3
-0.048
BX510934.1
0.158
mvp
-0.048
PLPP7 (1 of many)
0.154
si:dkey-248g15.3
-0.047
slc8a4a
0.149
icn
-0.047
XLOC-031060
0.147
galnt7
-0.047
si:ch211-121j5.4
0.146
gng13b
-0.047
zgc:152670
0.143
agr1
-0.046
faim2b
0.140
CR855311.1
-0.046
fat3a
0.140
crb3b
-0.045
crygs4
0.139
hdlbpa
-0.045
defbl1
0.135
si:dkey-65b12.6
-0.045
haus6
0.135
s100w
-0.045
si:dkey-61n16.5
0.134
rhoca
-0.045
XLOC-016049
0.131
zgc:174935
-0.045
ppp4r4
0.130
eevs
-0.045
pimr179
0.130
tcnbb
-0.044
CR786577.1
0.128
sdr16c5b
-0.044
zgc:153119
0.127
krt91
-0.044
dpyda.1
0.127
aldob
-0.044
tmem121ab
0.127
tmsb1
-0.044
smyhc2
0.126
krt4
-0.044
foxd1
0.125
zgc:175088
-0.043
cntn2
0.124
ier2b
-0.043
nek12
0.121
tesca
-0.043
si:dkey-12e7.4
0.121
zgc:112994
-0.043
chata
0.119
phlda2
-0.042
frs3
0.117
si:dkey-11c5.11
-0.042