Daniocell
aggf1 (mural cells / non-skeletal muscle)
angiogenic factor with G patch and FHA domains 1
ZFIN
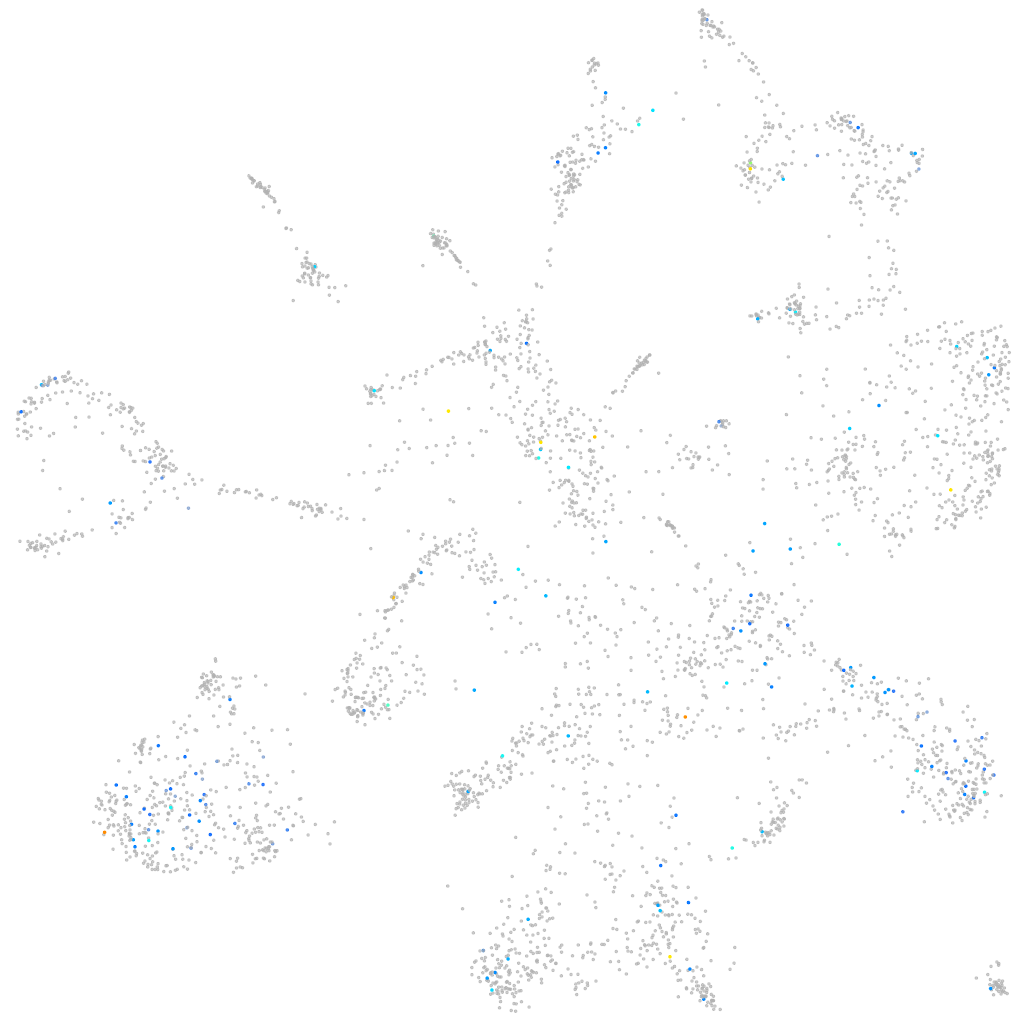
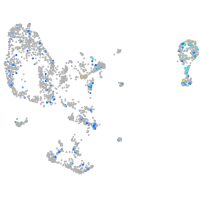
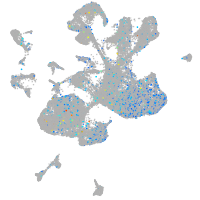
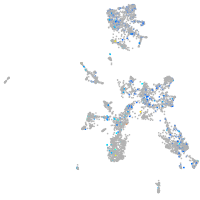
Gene expression UMAP
Display:
Expression
Stage
Other cell groups
all cells
blastomeres
PGCs
endoderm
axial mesoderm
muscle
mural cells /
non-skeletal muscle
mesenchyme
hematopoietic /
vasculature
pronephros
neural
spinal cord / glia
eye
taste / olfactory
otic / lateral line
epidermis
periderm
fin
ionocytes / mucous
pigment cells
Expression by stage/cluster
Correlated gene expression
Positive correlation
Negative correlation
Gene
r
Gene
r
cdh27
0.192
rplp2
-0.047
b3glctb
0.167
krt4
-0.041
tmc8
0.161
col4a1
-0.038
vrtn
0.160
zfp36l1b
-0.037
wu:fe17e08
0.158
CELA1 (1 of many)
-0.036
LOC110438973
0.155
mcl1b
-0.036
si:ch211-143l19.3
0.150
fhl3a
-0.035
NPC2 (1 of many)
0.148
plpp5
-0.035
zgc:171482
0.143
sema3d
-0.034
adcy1b
0.138
rtn3
-0.033
cacna1i
0.135
pvalb2
-0.033
si:ch211-120k19.1
0.131
idh3g
-0.033
c7b
0.130
amotl2a
-0.033
shisa9b
0.128
si:ch211-195b11.3
-0.033
XLOC-041857
0.128
acvrl1
-0.032
LOC110439529
0.127
adcy9
-0.032
mymk
0.125
emp2
-0.032
CR848788.2
0.125
lmod1b
-0.032
LOC101885373
0.124
zgc:112160
-0.032
LOC103910799
0.123
myl9b
-0.032
tlr22
0.123
hspg2
-0.032
si:ch211-252f13.5
0.123
mef2d
-0.032
XLOC-039146
0.120
lpp
-0.032
XLOC-031633
0.120
mapkapk2a
-0.031
znf1097
0.119
papss2b
-0.031
CR925761.1
0.119
prr14
-0.031
ANPEP
0.118
grk4
-0.030
CR854980.1
0.118
sirt1
-0.030
si:ch73-109d9.4
0.115
map1lc3a
-0.030
vopp1
0.115
tnnt2d
-0.030
znf1082
0.114
aldh2.1
-0.030
opn3
0.113
cmbl
-0.030
dmbx1b
0.113
lxn
-0.030
parp6b
0.112
BX322530.1
-0.030
mitfb
0.112
myofl
-0.029