Daniocell
adarb1a (blastomeres)
adenosine deaminase RNA specific B1a
ZFIN
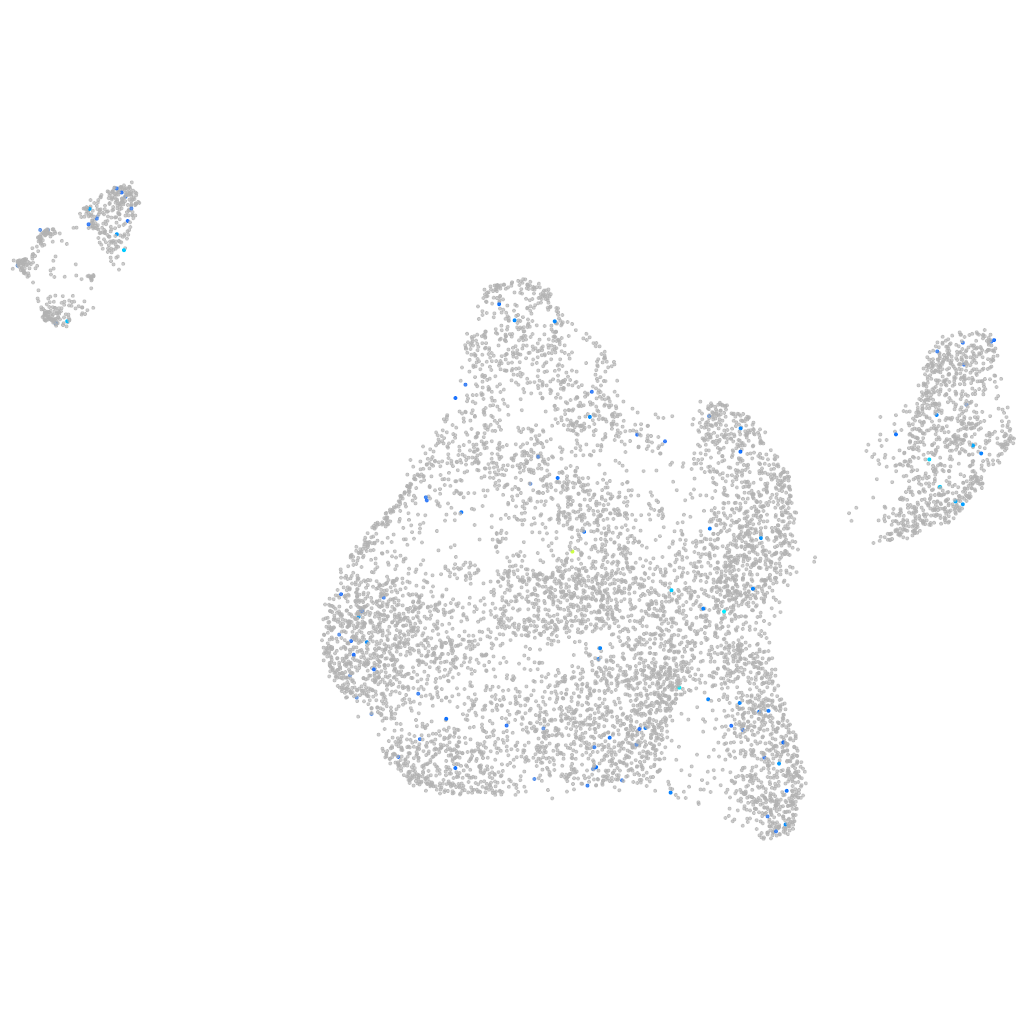
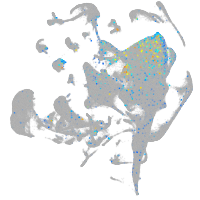
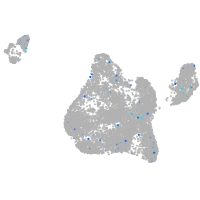
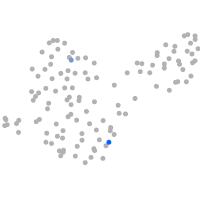
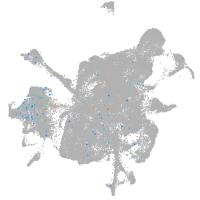
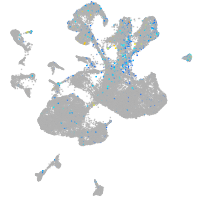
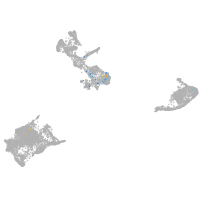
Gene expression UMAP
Display:
Expression
Stage
Other cell groups
all cells
blastomeres
PGCs
endoderm
axial mesoderm
muscle
mural cells /
non-skeletal muscle
mesenchyme
hematopoietic /
vasculature
pronephros
neural
spinal cord / glia
eye
taste / olfactory
otic / lateral line
epidermis
periderm
fin
ionocytes / mucous
pigment cells
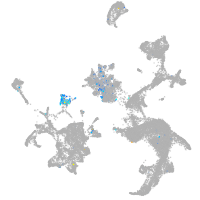
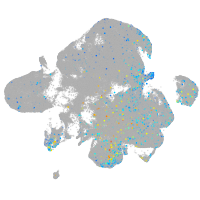
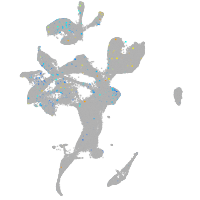
Expression by stage/cluster
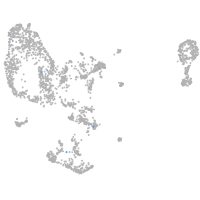
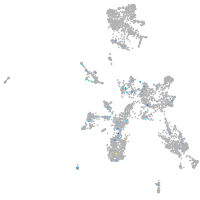
Correlated gene expression
Positive correlation
Negative correlation
Gene
r
Gene
r
LOC110438614
0.158
hspb1
-0.052
CU469584.1
0.149
rpl7a
-0.050
CR848665.1
0.148
ncl
-0.044
gcnt7
0.146
si:dkey-151g10.6
-0.042
aqp12
0.145
tubb2b
-0.039
eva1bb
0.144
dynll1
-0.039
amh
0.143
tuba8l4
-0.038
CABZ01099795.1
0.131
eef1a1l1
-0.037
XLOC-011126
0.126
anp32a
-0.036
LOC100332428
0.110
rpl19
-0.036
LOC100331417
0.107
hmgb2b
-0.035
FP016247.2
0.107
si:ch211-152c2.3
-0.035
LOC108181518
0.107
fthl27
-0.034
mfsd4ab
0.104
rps9
-0.034
si:ch211-256e16.4
0.102
hmgb2a
-0.033
cyp8b2
0.101
rps23
-0.032
LOC103910762
0.100
apoeb
-0.032
AL954698.1
0.100
ybx1
-0.032
fbxl8
0.099
rplp0
-0.031
XLOC-008420
0.099
pitpnbl
-0.031
si:ch211-79k12.1
0.099
degs1
-0.031
dsc2l
0.097
actn4
-0.030
mir459
0.096
pim1
-0.030
si:ch211-229n2.7
0.093
id1
-0.030
CR352226.4
0.091
rps15a
-0.030
BX324123.2
0.090
rpsa
-0.030
cyp2ae1
0.088
rps19
-0.030
XLOC-028243
0.088
ing5b
-0.030
tmem30c
0.086
rpl12
-0.029
si:ch211-120e1.7
0.086
rpl26
-0.029
CABZ01059623.1
0.085
stm
-0.029
fer1l6
0.083
hnrnpa0b
-0.029
loxl5a
0.083
rps20
-0.028
CABZ01063543.1
0.082
slc25a5
-0.028
BX511265.2
0.082
rpl22
-0.028