Daniocell
acvr1ba (otic / lateral line)
activin A receptor type 1Ba
ZFIN
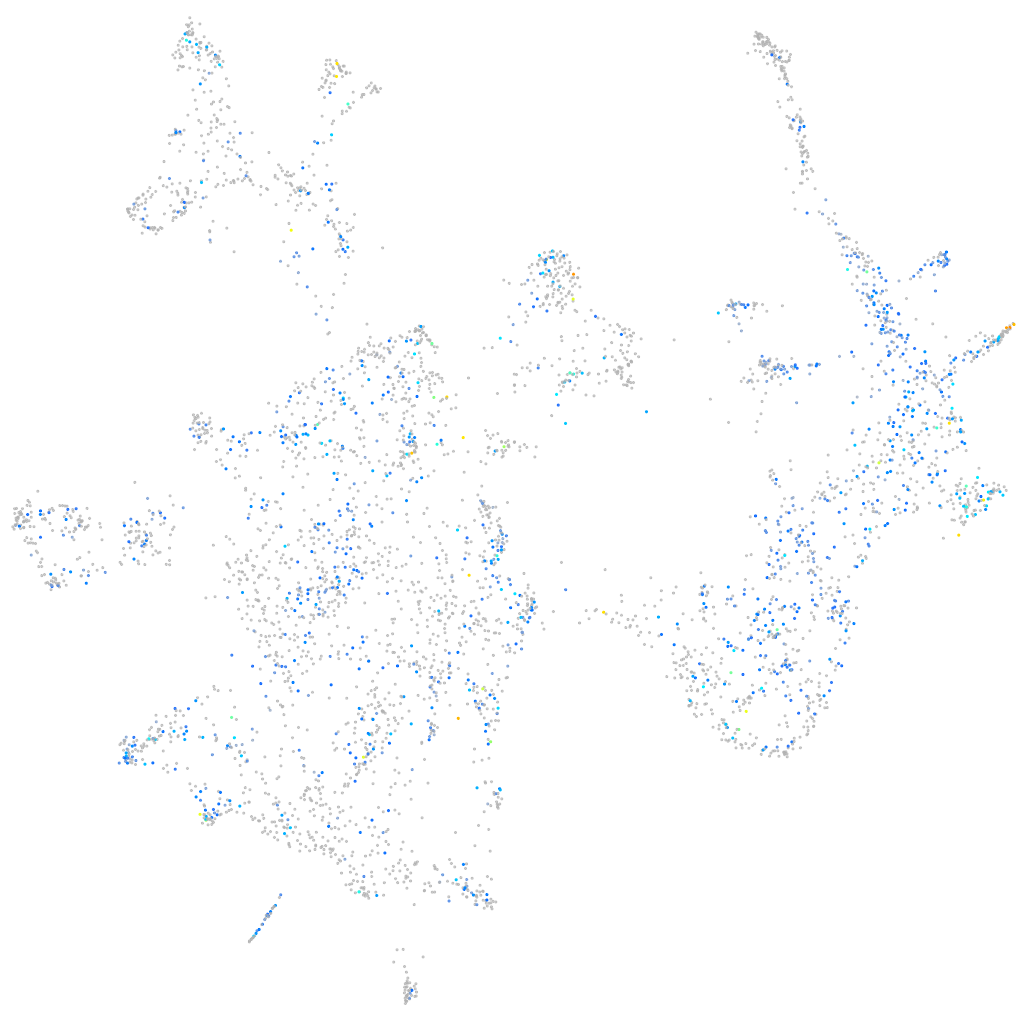
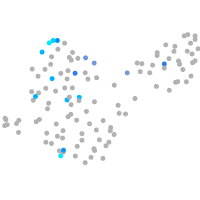
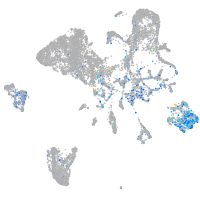
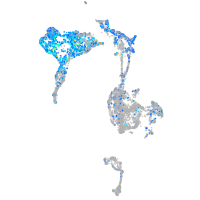
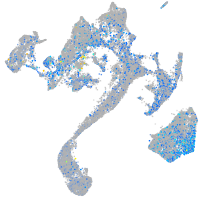
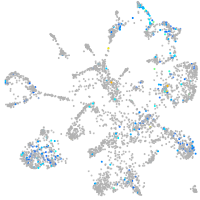
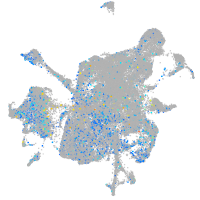
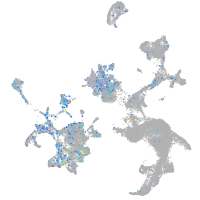
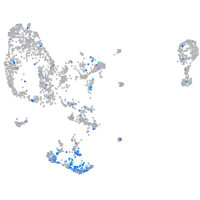
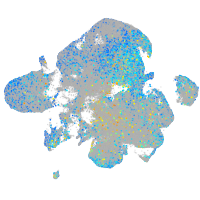
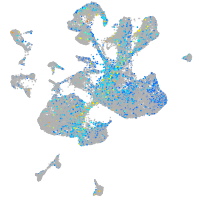
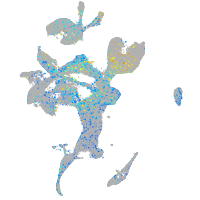
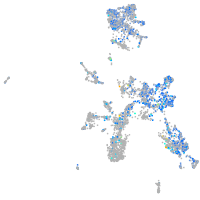
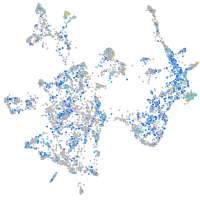
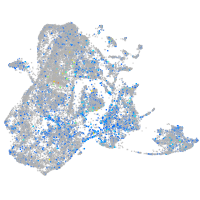
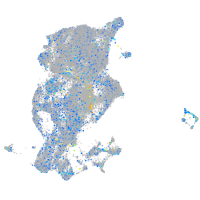
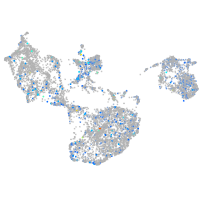
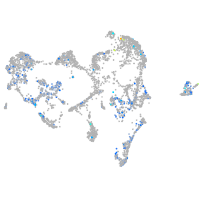
Gene expression UMAP
Display:
Expression
Stage
Other cell groups
all cells
blastomeres
PGCs
endoderm
axial mesoderm
muscle
mural cells /
non-skeletal muscle
mesenchyme
hematopoietic /
vasculature
pronephros
neural
spinal cord / glia
eye
taste / olfactory
otic / lateral line
epidermis
periderm
fin
ionocytes / mucous
pigment cells
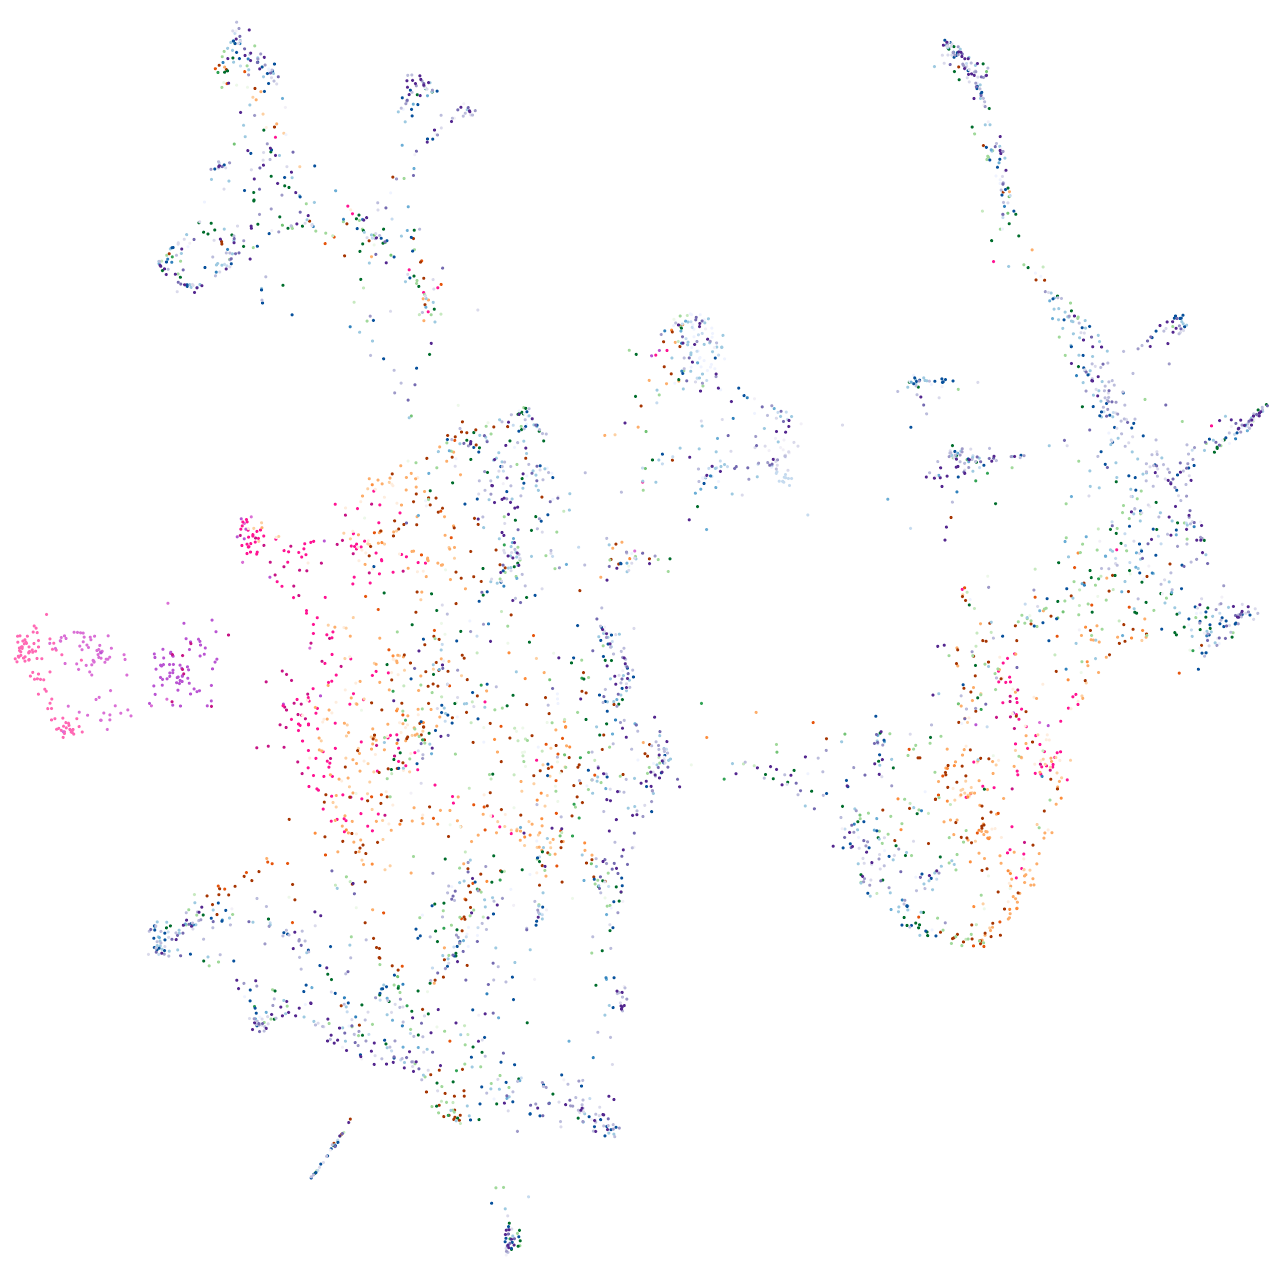
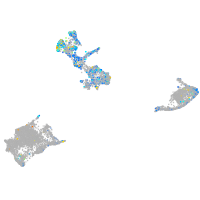
Expression by stage/cluster
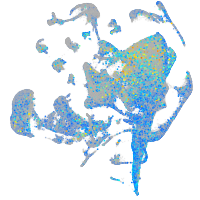
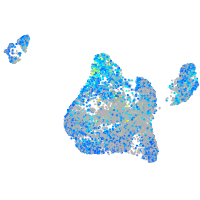
Correlated gene expression
Positive correlation
Negative correlation
Gene
r
Gene
r
zgc:158343
0.160
CR925719.1
-0.089
si:ch211-103f14.3
0.159
odf3l2a
-0.088
si:dkey-205h13.2
0.159
cabp2b
-0.081
si:ch211-98n17.5
0.157
hsd17b7
-0.080
krt1-c5
0.157
smpx
-0.079
tent5bb
0.156
gipc3
-0.079
tmsb
0.154
si:ch211-193l2.10
-0.079
phlda2
0.150
nptna
-0.078
si:dkey-103g5.3
0.150
atp1a3b
-0.078
negaly6
0.149
s100s
-0.078
epcam
0.143
aldocb
-0.077
gbgt1l3
0.143
apba1a
-0.076
si:dkey-33m11.8
0.138
pacrg
-0.076
tmem176l.4
0.138
pou4f3
-0.075
si:ch211-39i22.1
0.137
dnajc5b
-0.075
gpx1a
0.136
erich2
-0.074
krt18b
0.136
vsig10l2
-0.074
soul2
0.135
cd164l2
-0.074
LOC100536887
0.134
tescb
-0.074
moxd1l
0.134
pou4f1
-0.073
rorb
0.133
ndufa4
-0.073
elf3
0.132
CABZ01080568.1
-0.072
LOC799574
0.130
tspan13b
-0.072
gsnb
0.130
osbpl1a
-0.071
abca12
0.130
gfi1aa
-0.071
net1
0.129
bdnf
-0.071
acsl1a
0.129
emb
-0.071
pdia3
0.129
clic5b
-0.071
spaca4l
0.128
SPATA48
-0.071
irg1l
0.128
tmem240b
-0.070
si:ch211-195b11.3
0.127
lmo7b
-0.070
BX663503.2
0.127
gpx2
-0.069
selenom
0.126
tmc2b
-0.069
fxyd6l
0.126
zgc:194210
-0.068
zfp36l1b
0.126
ccdc114
-0.068