Daniocell
actn2b (blastomeres)
"actinin, alpha 2b"
ZFIN
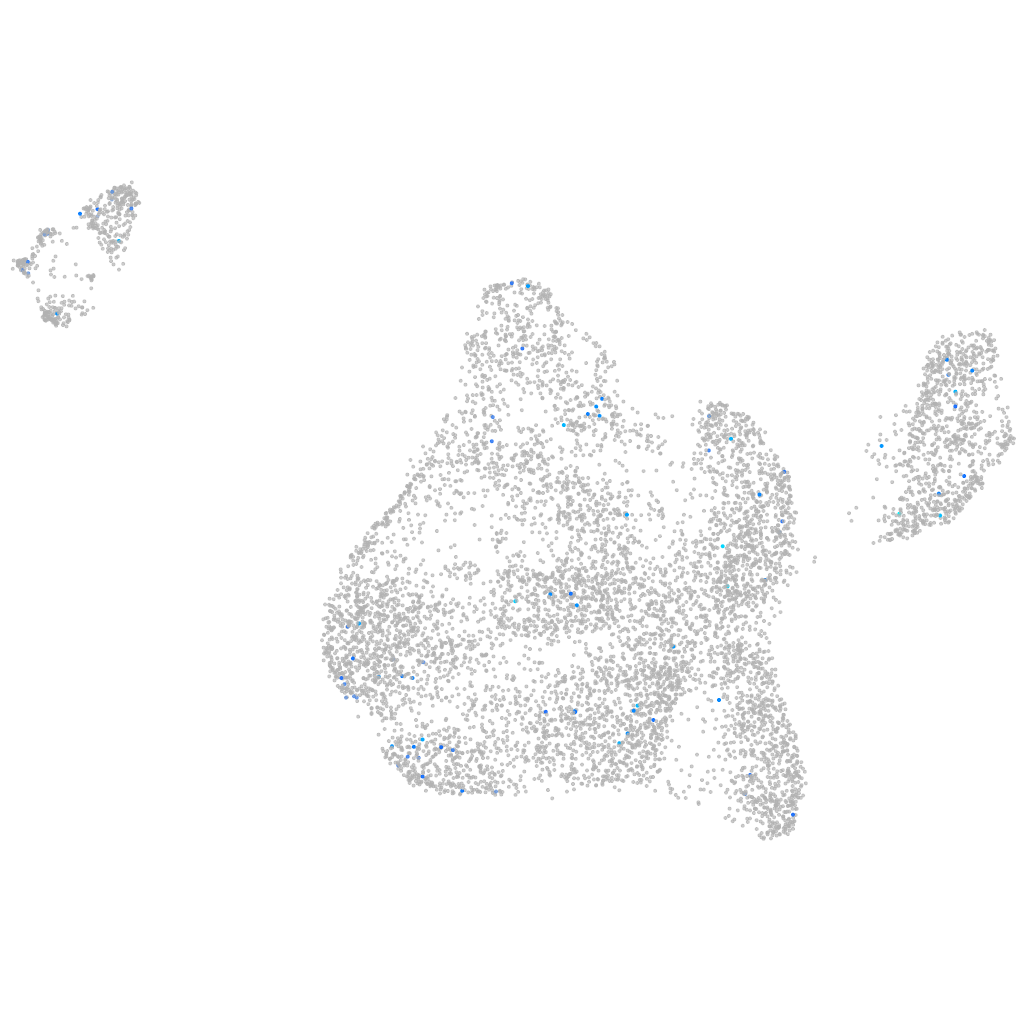
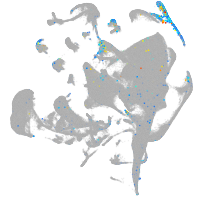
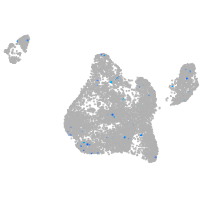
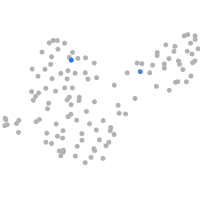
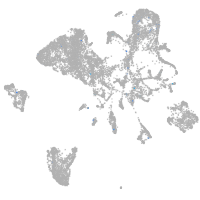
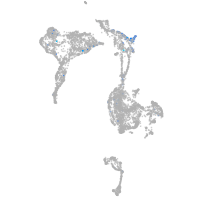
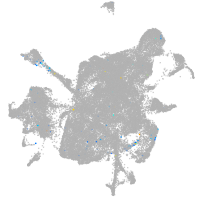
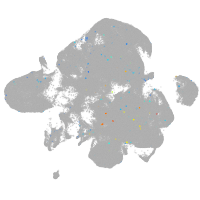
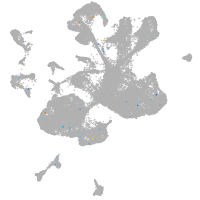
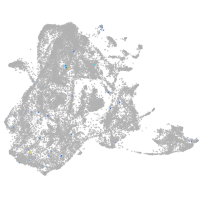
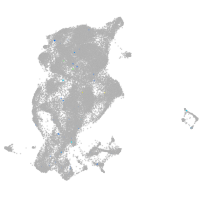
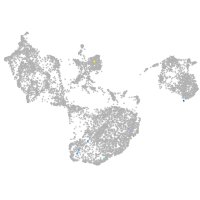
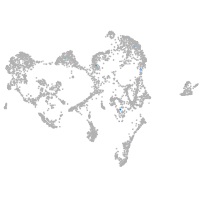
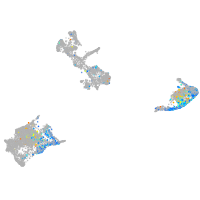
Gene expression UMAP
Display:
Expression
Stage
Other cell groups
all cells
blastomeres
PGCs
endoderm
axial mesoderm
muscle
mural cells /
non-skeletal muscle
mesenchyme
hematopoietic /
vasculature
pronephros
neural
spinal cord / glia
eye
taste / olfactory
otic / lateral line
epidermis
periderm
fin
ionocytes / mucous
pigment cells
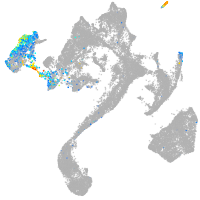
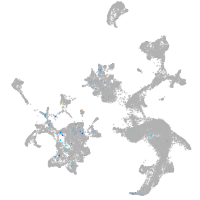
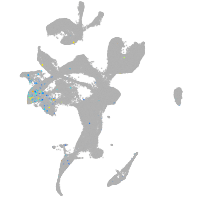
Expression by stage/cluster
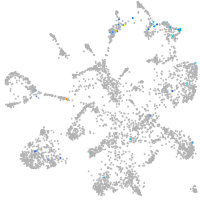
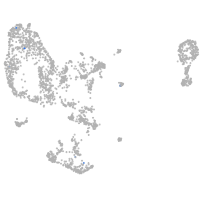
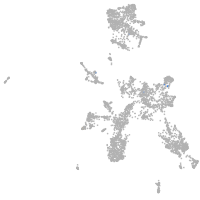
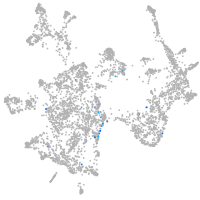
Correlated gene expression
Positive correlation
Negative correlation
Gene
r
Gene
r
FO681390.1
0.183
ptmab
-0.038
BX248318.1
0.156
anp32e
-0.037
irf3
0.140
hspb1
-0.037
BX470189.2
0.139
rps20
-0.036
SMIM18
0.139
dynll1
-0.034
htr2b
0.136
krr1
-0.034
BX323854.2
0.132
dnajc17
-0.034
pimr82
0.131
hmgb2b
-0.033
spag1b
0.129
hnrnpa0b
-0.033
LOC108183658
0.127
si:ch211-152c2.3
-0.032
si:ch73-359m17.7
0.126
rpl35a
-0.032
LOC101887002
0.125
si:ch73-1a9.3
-0.031
CR383669.2
0.124
rplp1
-0.031
XLOC-007138
0.123
rps15a
-0.030
LO018493.2
0.123
aldob
-0.029
LOC110438556
0.118
si:dkey-239h2.3
-0.028
arhgap20b
0.118
stm
-0.028
AL954134.2
0.117
ca9
-0.028
XLOC-043355
0.116
hmgn6
-0.027
LOC101886963
0.115
rps15
-0.027
sv2ba
0.110
hspa8
-0.027
si:dkey-266f7.4
0.108
eef1a1l1
-0.027
crygs1
0.108
mapk8ip3
-0.027
rhpn1
0.106
marcksl1b
-0.026
selenou1b
0.106
rps14
-0.026
ryr2a
0.101
farp2
-0.026
BX120005.1
0.101
fkbp1aa
-0.026
cfhl1
0.101
chd4b
-0.026
CR792438.1
0.099
chmp2a
-0.026
dmrt2b
0.099
cirbpa
-0.026
bsx
0.099
si:ch1073-190k2.1
-0.026
myo15b
0.097
hnrnpub
-0.026
zgc:172133
0.096
hmgn2
-0.026
LOC101883862
0.095
snu13a
-0.025
tmc5
0.094
rps4x
-0.025