Daniocell
acta1a (pronephros)
"actin alpha 1, skeletal muscle a"
ZFIN
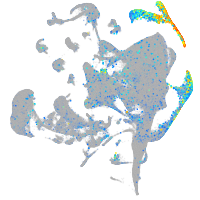
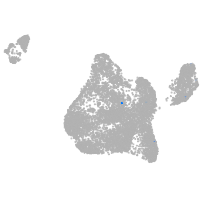
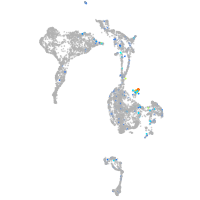
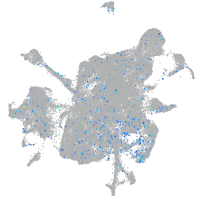
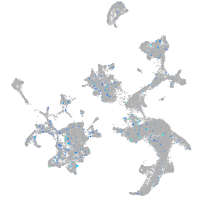
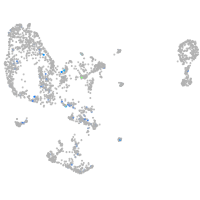
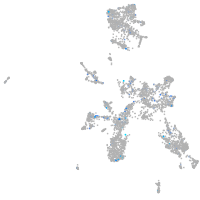
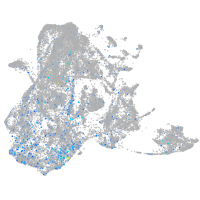
Gene expression UMAP
Display:
Expression
Stage
Other cell groups
all cells
blastomeres
PGCs
endoderm
axial mesoderm
muscle
mural cells /
non-skeletal muscle
mesenchyme
hematopoietic /
vasculature
pronephros
neural
spinal cord / glia
eye
taste / olfactory
otic / lateral line
epidermis
periderm
fin
ionocytes / mucous
pigment cells
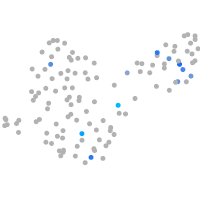
Expression by stage/cluster
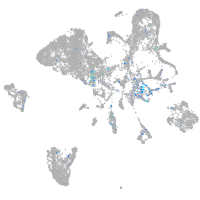
Correlated gene expression
Positive correlation
Negative correlation
Gene
r
Gene
r
XLOC-038091
0.350
ppiaa
-0.072
si:dkeyp-75h12.7
0.340
eci2
-0.069
LOC108190613
0.287
si:ch211-139a5.9
-0.067
ahrra
0.263
rpl4
-0.066
CR385041.1
0.263
glud1b
-0.063
CU466278.1
0.263
rps18
-0.062
klhl40b
0.263
asl
-0.057
si:ch211-89o9.4
0.263
dhfr
-0.057
tacr1a
0.263
tpp1
-0.056
twf2a
0.263
shmt2
-0.055
kbtbd13
0.263
mt-nd3
-0.055
LOC101882356
0.263
pabpc1a
-0.055
smyhc3
0.263
hnrnpm
-0.055
si:ch73-29c22.1
0.263
oplah
-0.054
si:dkey-38l22.2
0.263
acaa1
-0.054
myoz2b
0.263
tmem14ca
-0.054
cavin4b
0.246
gstt2
-0.053
myoz2a
0.242
sdr16c5b
-0.053
XLOC-044291
0.241
si:ch211-117n7.6
-0.053
XLOC-030027
0.237
atp5mf
-0.052
FQ976909.1
0.234
CABZ01032488.1
-0.052
zgc:112001
0.232
mt-co1
-0.052
si:ch211-225b10.3
0.231
prdx6
-0.052
CABZ01088229.1
0.229
slc47a4
-0.052
CU633479.2
0.226
srd5a2a
-0.051
cacna1sa
0.222
cox6a2
-0.051
evpll
0.222
mavs
-0.050
si:dkeyp-1h4.6
0.220
hnrnpa1a
-0.050
si:dkey-241l7.3
0.219
cox8b
-0.049
lcn15
0.215
rgrb
-0.049
pdzrn4
0.215
stra6
-0.049
mybpc3
0.214
sephs2
-0.049
si:ch211-151h10.2
0.212
ebna1bp2
-0.049
kif25
0.212
gstt1a
-0.048
LOC101885158
0.212
hsd20b2
-0.048