
acyl-CoA synthetase bubblegum family member 2
ZFIN 
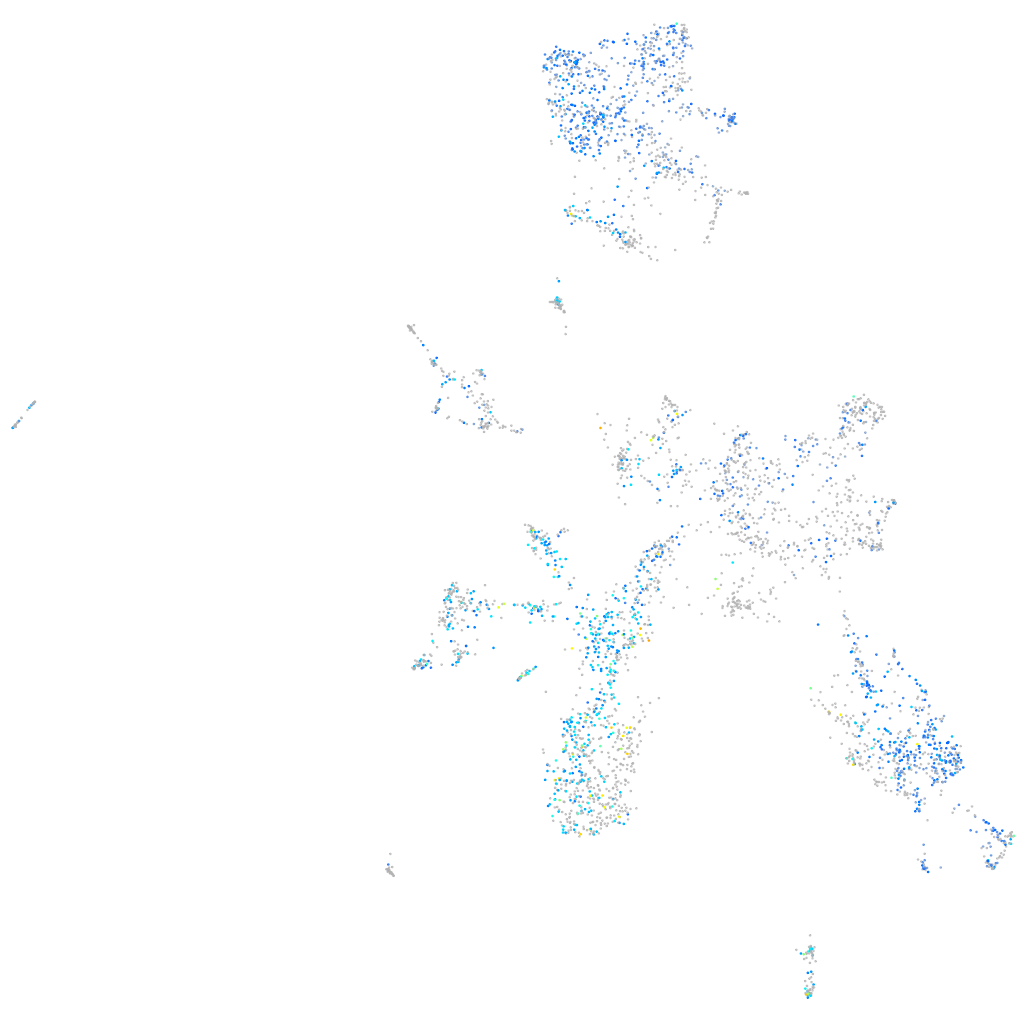
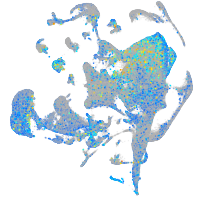
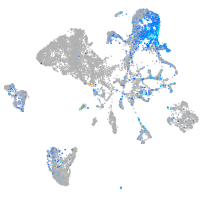
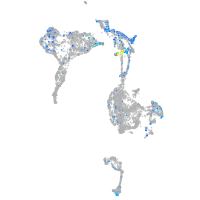
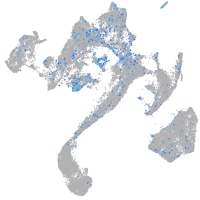
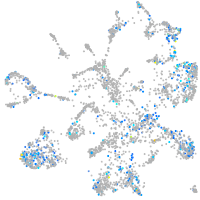
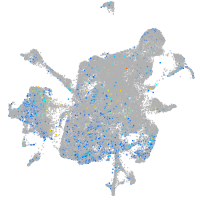
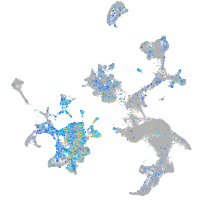
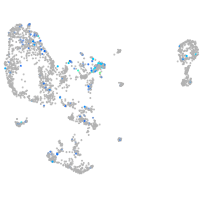
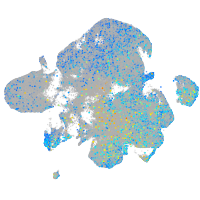
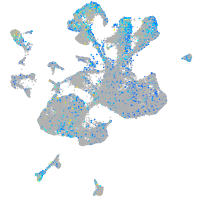
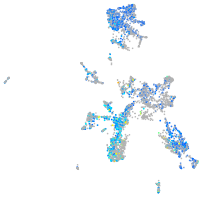
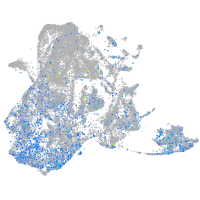
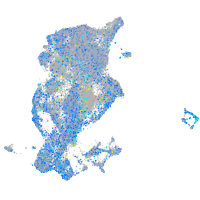
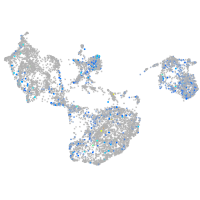
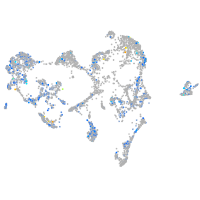
Gene expression UMAP


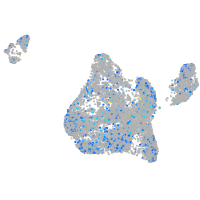
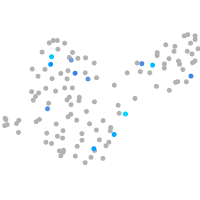
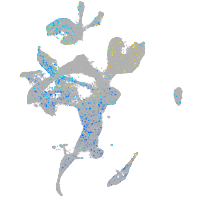
Expression by stage/cluster
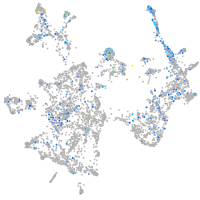
Correlated gene expression
| Positive correlation | Negative correlation | ||
| Gene | r | Gene | r |
| gsna | 0.288 | si:dkey-151g10.6 | -0.189 |
| tuba1c | 0.284 | rpl23 | -0.164 |
| gdi1 | 0.283 | her15.1 | -0.163 |
| anxa5b | 0.277 | snu13b | -0.157 |
| gnb1a | 0.275 | npm1a | -0.150 |
| vamp2 | 0.269 | rpl39 | -0.150 |
| zgc:65894 | 0.264 | rps24 | -0.149 |
| tspan2a | 0.263 | rplp1 | -0.149 |
| LOC100537342 | 0.262 | rpl37 | -0.148 |
| rtn1a | 0.258 | rps27a | -0.148 |
| calr | 0.257 | rpl10a | -0.147 |
| cldnh | 0.256 | rps23 | -0.146 |
| atf5a | 0.256 | rpl29 | -0.146 |
| ywhah | 0.249 | nop10 | -0.145 |
| calm1a | 0.248 | col14a1a | -0.144 |
| rab6bb | 0.244 | rplp2l | -0.144 |
| sncb | 0.243 | COX7A2 (1 of many) | -0.142 |
| flot2b | 0.238 | rps29 | -0.139 |
| si:dkeyp-75h12.5 | 0.237 | rps28 | -0.138 |
| adcyap1b | 0.234 | nutf2l | -0.137 |
| maptb | 0.233 | mcm7 | -0.137 |
| tnrc6c1 | 0.233 | rps7 | -0.136 |
| si:ch211-10a23.2 | 0.233 | six3b | -0.136 |
| atp1b1a | 0.231 | rpl26 | -0.136 |
| ncam1a | 0.231 | her4.1 | -0.135 |
| uchl1 | 0.226 | dut | -0.135 |
| stmn1b | 0.225 | nasp | -0.134 |
| map1b | 0.224 | id1 | -0.134 |
| map1aa | 0.223 | ddx21 | -0.134 |
| gng3 | 0.221 | rps15a | -0.134 |
| appa | 0.221 | stmn1a | -0.134 |
| fam49a | 0.221 | rps15 | -0.133 |
| selenot1a | 0.221 | rpl7 | -0.132 |
| gng13b | 0.221 | mcm6 | -0.132 |
| gabarapa | 0.220 | her12 | -0.130 |