Daniocell
acbd5a (ionocytes / mucous-producing)
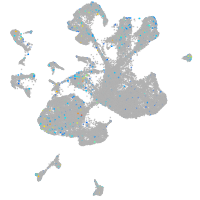
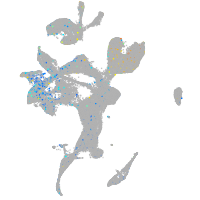
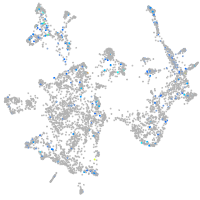
acyl-CoA binding domain containing 5a
ZFIN
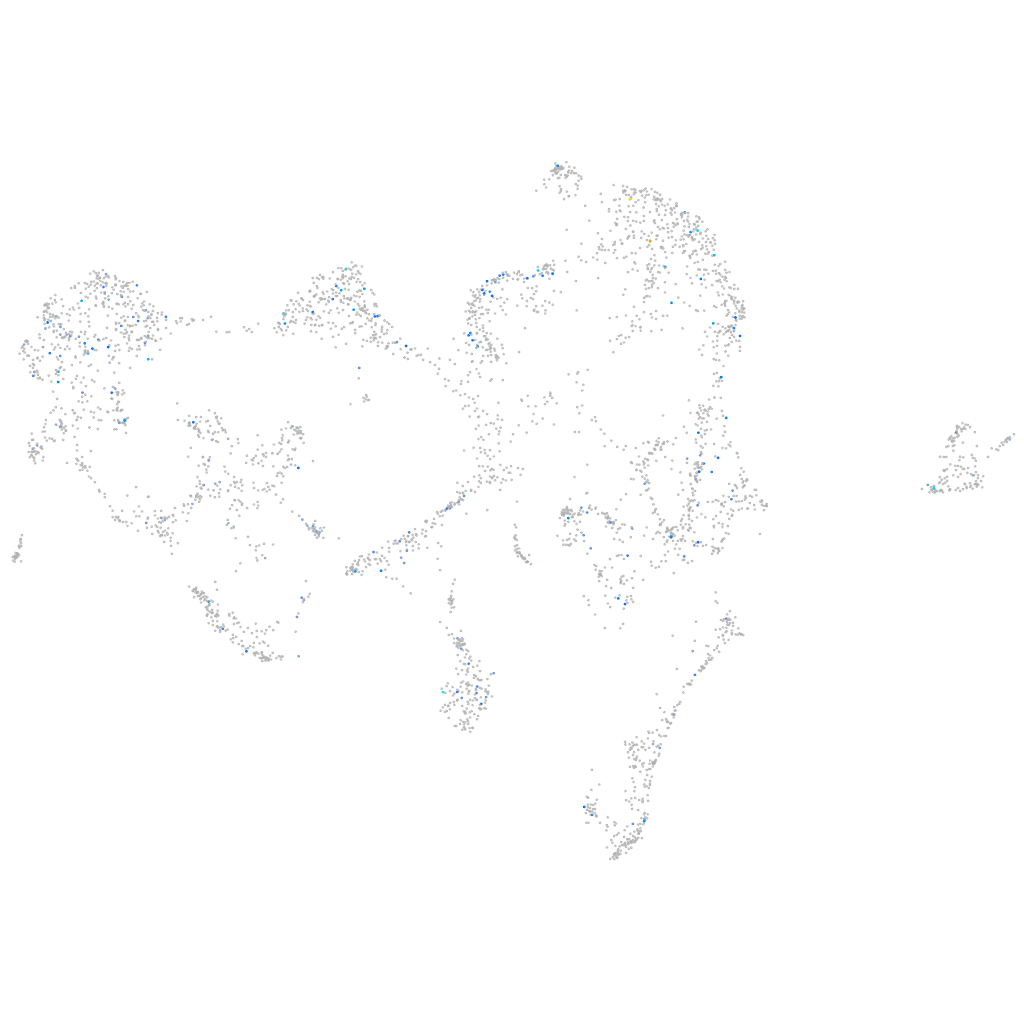
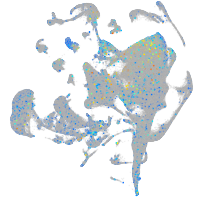
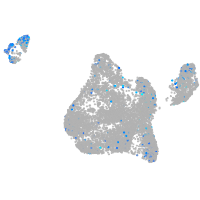
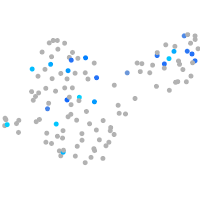
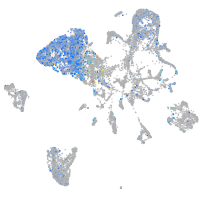
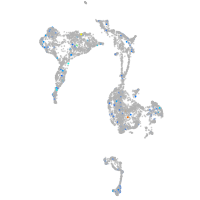
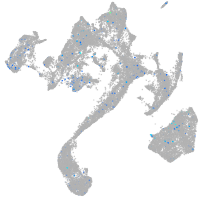
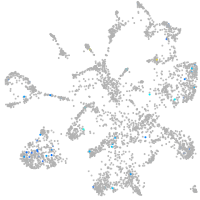
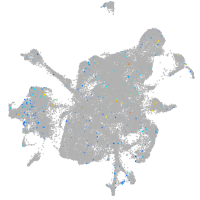
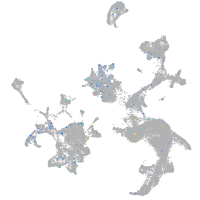
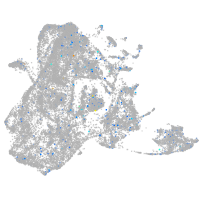
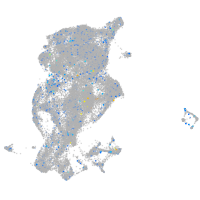
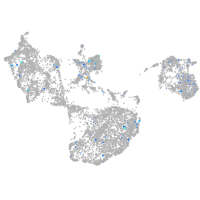
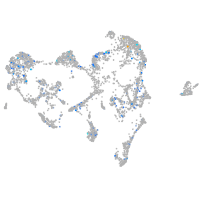
Gene expression UMAP
Display:
Expression
Stage
Other cell groups
all cells
blastomeres
PGCs
endoderm
axial mesoderm
muscle
mural cells /
non-skeletal muscle
mesenchyme
hematopoietic /
vasculature
pronephros
neural
spinal cord / glia
eye
taste / olfactory
otic / lateral line
epidermis
periderm
fin
ionocytes / mucous
pigment cells
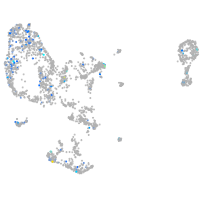
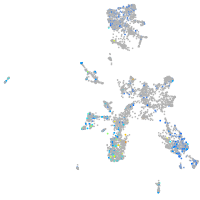
Expression by stage/cluster
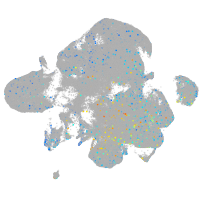
Correlated gene expression
Positive correlation
Negative correlation
Gene
r
Gene
r
LOC110438674
0.237
si:dkey-23i12.5
-0.055
XLOC-016403
0.232
snu13b
-0.051
si:ch73-106g13.1
0.231
ptmab
-0.050
itih3a
0.231
nop16
-0.049
BX323051.1
0.230
ppiaa
-0.048
s100b
0.217
si:ch211-222l21.1
-0.048
si:ch73-199e17.1
0.205
ube2g1b
-0.047
IYD
0.177
si:dkey-151g10.6
-0.046
mhc1lda
0.174
eif4e1c
-0.044
BX663525.2
0.172
snrpb
-0.043
si:dkey-199m13.7
0.169
eif3ja
-0.043
BX901974.1
0.167
pak2a
-0.043
BX511259.1
0.162
pin4
-0.043
trpm1b
0.158
tmsb4x
-0.042
XLOC-036447
0.155
zgpat
-0.042
AL935186.1
0.151
tm2d1
-0.041
slc25a3a
0.149
rplp2l
-0.041
scara5
0.148
npm1a
-0.041
CU929451.1
0.148
stimate
-0.040
LOC108184018
0.145
rbmx
-0.039
slco2a1
0.144
erbin
-0.039
aptx
0.142
ephb4a
-0.039
agtr2
0.139
psmc3ip
-0.039
CR356233.2
0.136
hmgn6
-0.038
kcna2b
0.133
rpl37
-0.038
apoba
0.132
stmn1a
-0.038
LOC101885337
0.132
apoeb
-0.038
slc35d2
0.130
col1a2
-0.038
plcd3b
0.129
nectin1b
-0.038
ankrd46b
0.129
rps27.1
-0.038
stk33
0.128
mettl2a
-0.038
CABZ01069040.1
0.127
alcamb
-0.037
grid2
0.125
cirbpa
-0.037
BX927336.3
0.124
nasp
-0.037
LOC101882128
0.124
si:dkey-151g10.3
-0.037