Daniocell
acadsb (epidermis)
acyl-CoA dehydrogenase short/branched chain
ZFIN
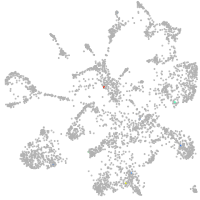
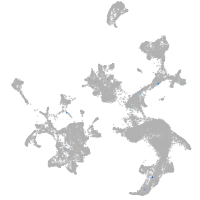
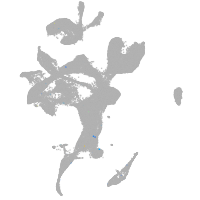
Gene expression UMAP
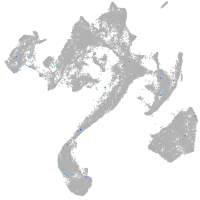
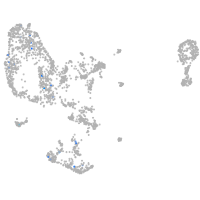
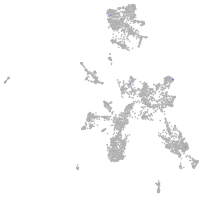
Display:
Expression
Stage
Other cell groups
all cells
blastomeres
PGCs
endoderm
axial mesoderm
muscle
mural cells /
non-skeletal muscle
mesenchyme
hematopoietic /
vasculature
pronephros
neural
spinal cord / glia
eye
taste / olfactory
otic / lateral line
epidermis
periderm
fin
ionocytes / mucous
pigment cells
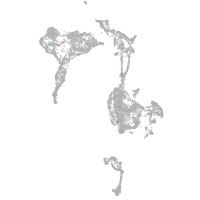
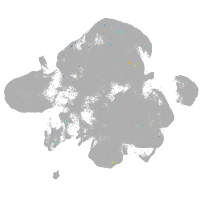
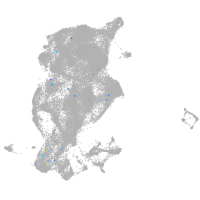
Expression by stage/cluster
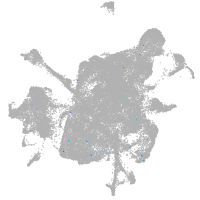
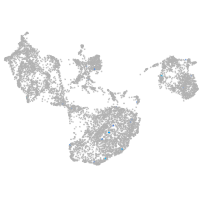
Correlated gene expression
Positive correlation
Negative correlation
Gene
r
Gene
r
LOC101884142
0.276
calua
-0.019
lpar4
0.220
sult2st1
-0.017
LOC108183639
0.141
tfap2a
-0.015
LOC110438276
0.139
pelo
-0.015
si:dkey-192l18.9
0.123
si:ch211-213d14.2
-0.015
XLOC-039758
0.119
tnfaip8l2b
-0.015
LOC110439791
0.113
actb2
-0.015
il11b
0.104
wls
-0.014
best4
0.102
ssr4
-0.014
CR854948.1
0.100
fermt1
-0.014
BX640520.3
0.096
zgc:92744
-0.014
LOC108190923
0.088
rab13
-0.014
arhgap23b
0.087
pacsin3
-0.014
XLOC-026454
0.086
zgc:162730
-0.014
LOC108179079
0.085
CR383676.1
-0.014
znrd1
0.085
id3
-0.014
mylk2
0.078
calm2a
-0.013
si:ch211-271e10.2
0.075
tmem167a
-0.013
SBSPON
0.074
clk4a
-0.013
LOC101882727
0.074
p3h3
-0.013
ccdc85a
0.071
nuak2
-0.013
chrm1a
0.071
poldip2
-0.013
LOC110439344
0.070
sept6
-0.013
rxfp2l
0.068
mycb
-0.013
nt5c1ba
0.065
arrdc3b
-0.013
XLOC-044320
0.065
txnipa
-0.013
CR513782.1
0.064
ube2ka
-0.013
parp6a
0.063
pim2
-0.013
CR925737.1
0.063
CABZ01090890.1
-0.013
dicp1.5-6
0.063
fn1a
-0.013
FO904868.1
0.062
zgc:112185
-0.013
LOC110439880
0.061
myl6
-0.013
ngef
0.060
med21
-0.013
LOC110439964
0.060
NC-002333.17
-0.012
aifm4
0.059
tspan7
-0.012