Daniocell
abtb2b (otic / lateral line)
ankyrin repeat and BTB (POZ) domain containing 2b
ZFIN
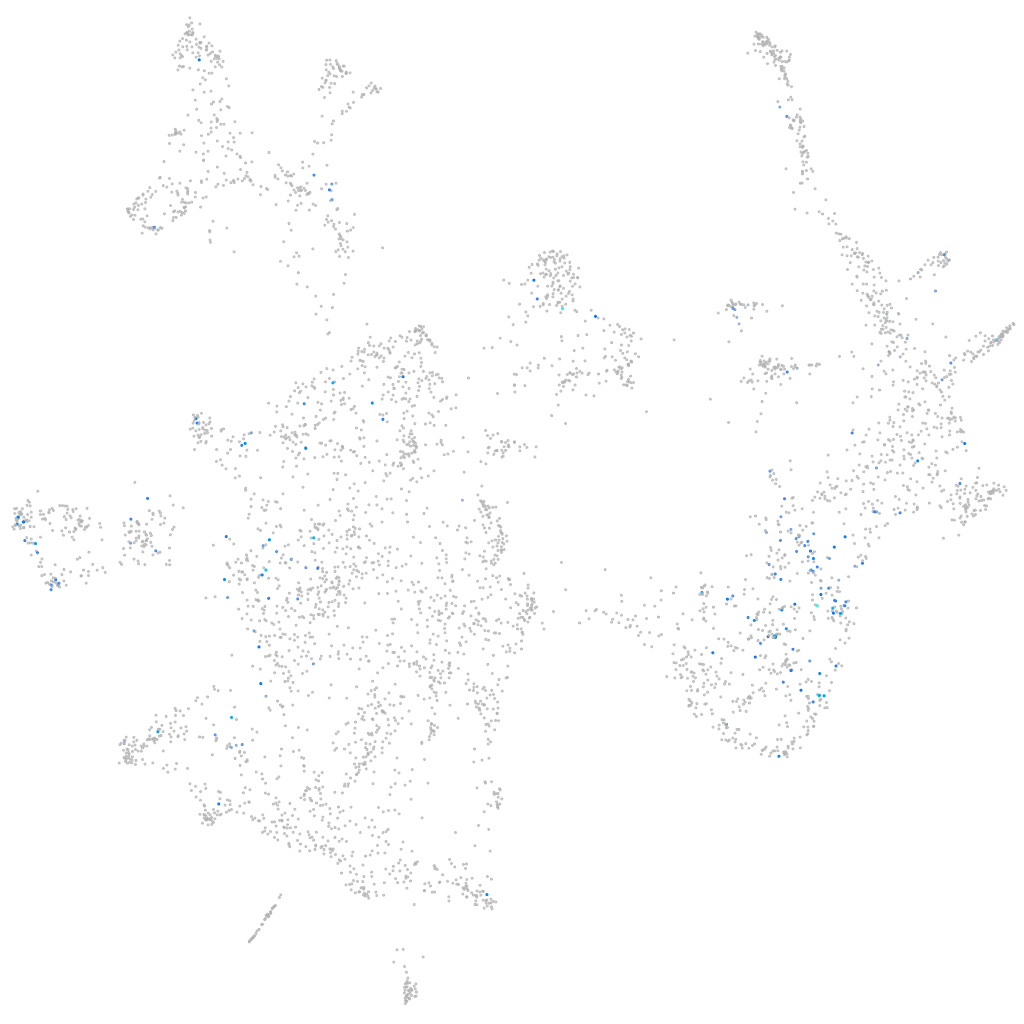
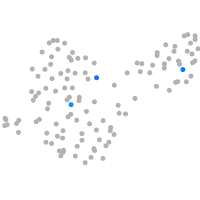
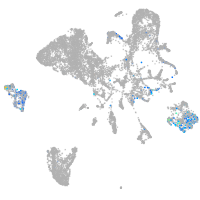
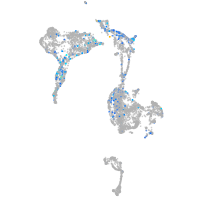
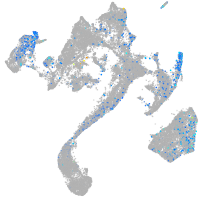
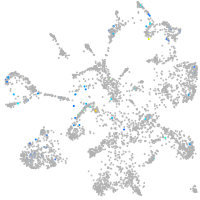
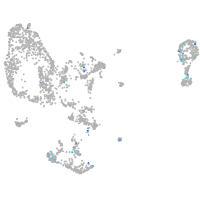
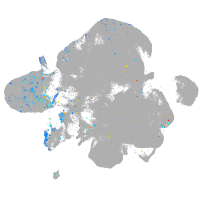
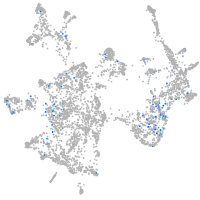
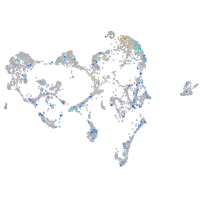
Gene expression UMAP
Display:
Expression
Stage
Other cell groups
all cells
blastomeres
PGCs
endoderm
axial mesoderm
muscle
mural cells /
non-skeletal muscle
mesenchyme
hematopoietic /
vasculature
pronephros
neural
spinal cord / glia
eye
taste / olfactory
otic / lateral line
epidermis
periderm
fin
ionocytes / mucous
pigment cells
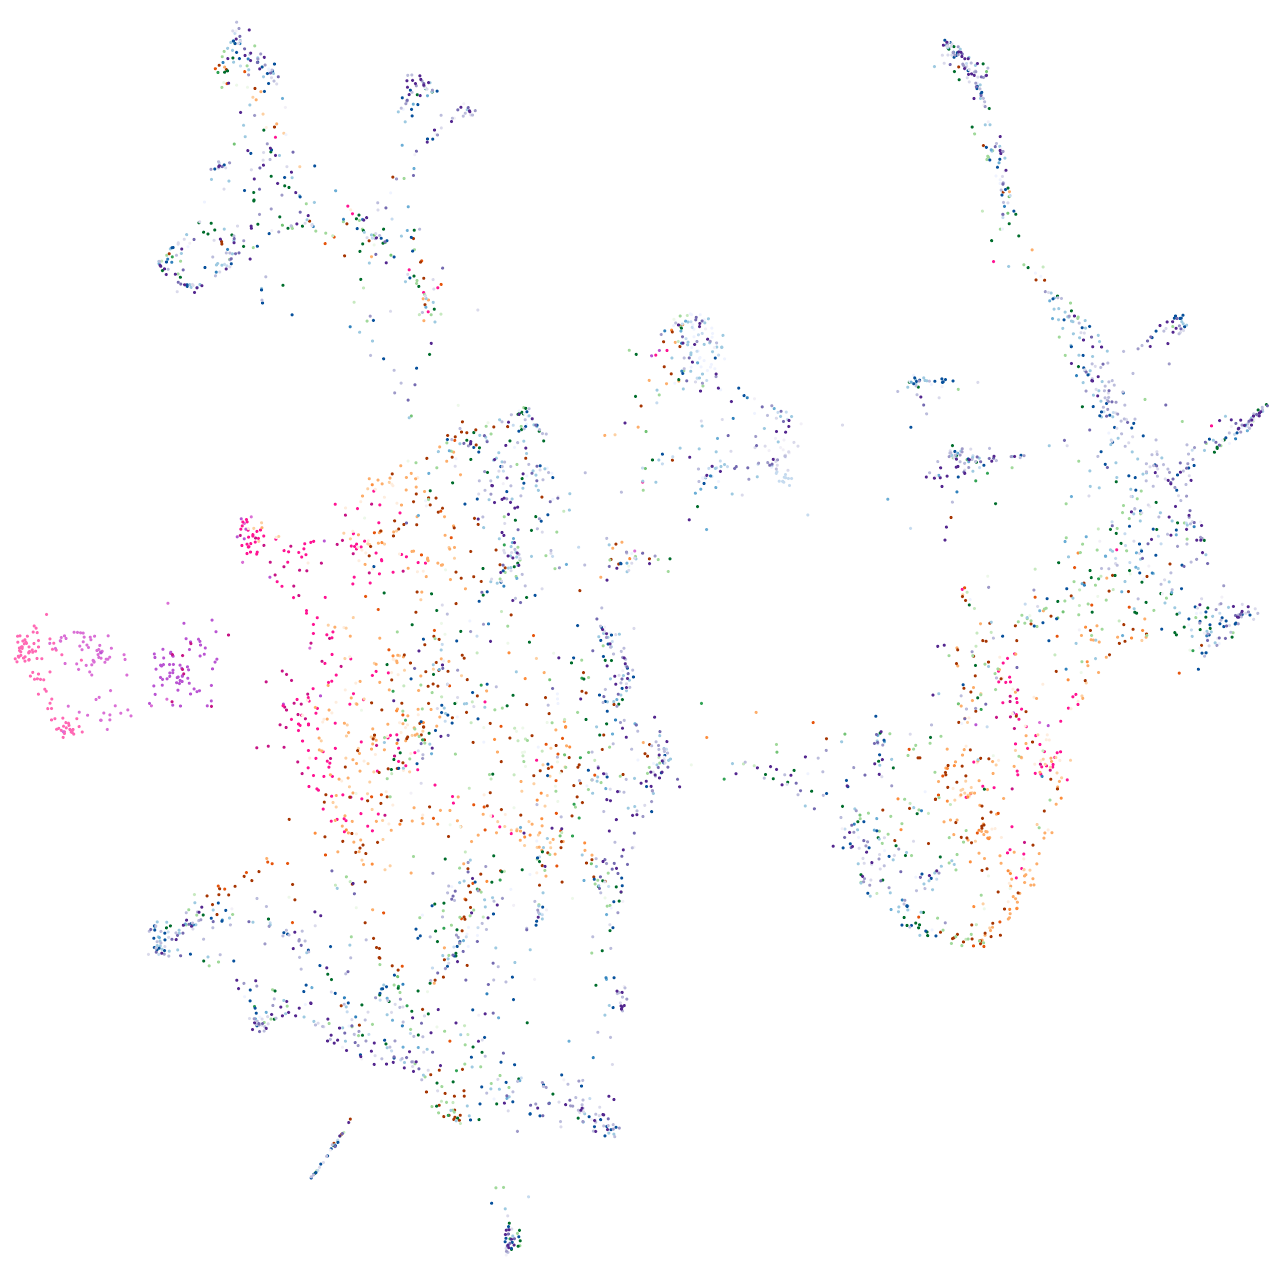
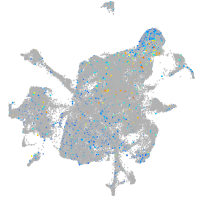
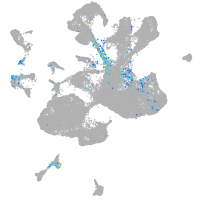
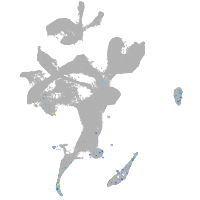
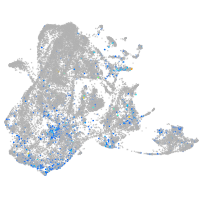
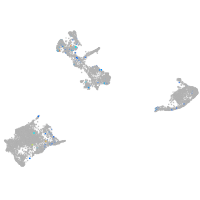
Expression by stage/cluster
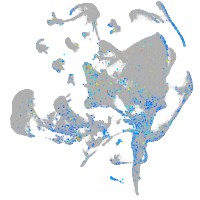
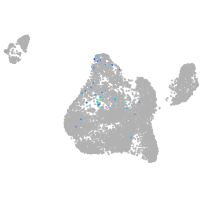
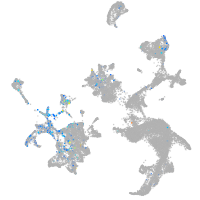
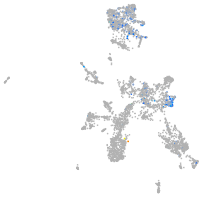
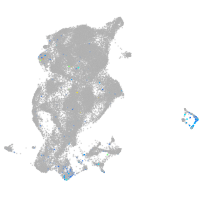
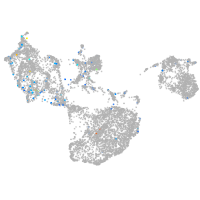
Correlated gene expression
Positive correlation
Negative correlation
Gene
r
Gene
r
si:ch211-276a17.5
0.188
pvalb2
-0.096
CU633857.1
0.185
pvalb1
-0.092
si:dkey-81p22.11
0.164
col11a1a
-0.081
cxcr4b
0.154
col2a1a
-0.080
LO018011.1
0.148
col9a2
-0.077
LOC100148237
0.148
col9a1a
-0.075
ly6m7
0.144
actc1b
-0.074
hoxb8a
0.141
eno1a
-0.073
ccdc36
0.140
gapdhs
-0.070
ARSB
0.139
col9a3
-0.070
arid3b
0.136
matn4
-0.067
apex1
0.132
si:ch211-243g18.2
-0.066
si:ch211-191i18.2
0.131
apoa2
-0.064
si:dkey-11o18.5
0.130
ip6k2a
-0.064
si:ch211-222l21.1
0.129
wfdc2
-0.063
her15.1
0.128
otomp
-0.062
si:ch211-256e16.6
0.126
col9a1b
-0.062
hoxc1a
0.123
col2a1b
-0.062
LOC101883142
0.123
col11a2
-0.060
her12
0.123
apoa1b
-0.060
CR847785.1
0.121
nfia
-0.059
LOC108182241
0.120
si:ch1073-184j22.1
-0.058
sez6b
0.120
tnni2a.4
-0.058
mycn
0.119
ckbb
-0.058
BX927258.1
0.119
anxa13
-0.057
sash1a
0.118
tspan13b
-0.057
CR936518.2
0.118
calm1b
-0.057
fhl3a
0.118
fbln7
-0.057
samd7
0.118
tmem59
-0.056
XLOC-042669
0.116
gngt2b
-0.056
XLOC-001964
0.116
otofb
-0.056
FO681314.1
0.116
COX3
-0.054
XLOC-044272
0.116
purab
-0.053
hmga1a
0.115
rnasekb
-0.053
fndc1
0.115
itm2ba
-0.053