Daniocell
abi2b (pigment cells)
abl-interactor 2b
ZFIN
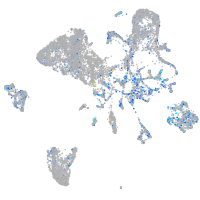
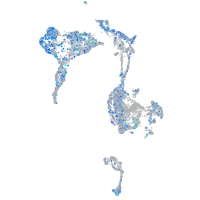
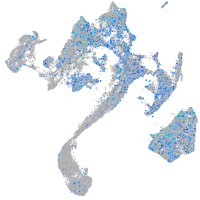
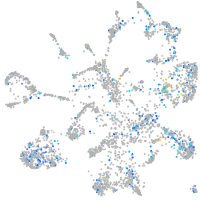
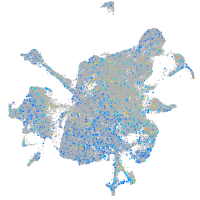
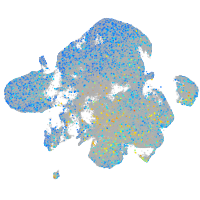
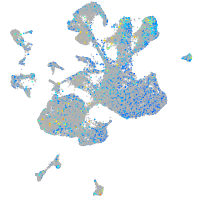
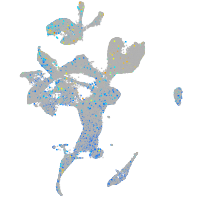
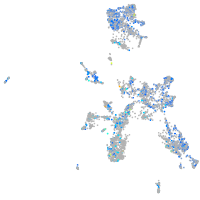
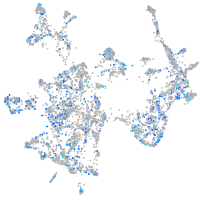
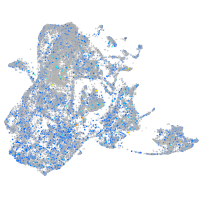
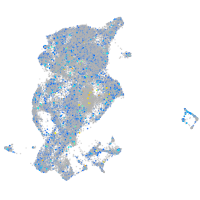
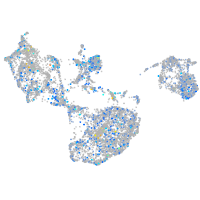
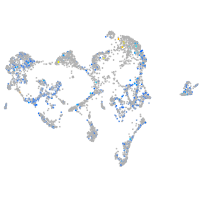
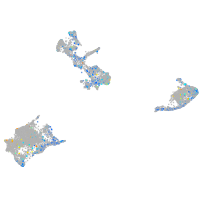
Gene expression UMAP
Display:
Expression
Stage
Other cell groups
all cells
blastomeres
PGCs
endoderm
axial mesoderm
muscle
mural cells /
non-skeletal muscle
mesenchyme
hematopoietic /
vasculature
pronephros
neural
spinal cord / glia
eye
taste / olfactory
otic / lateral line
epidermis
periderm
fin
ionocytes / mucous
pigment cells
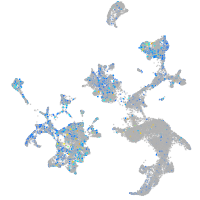
Expression by stage/cluster
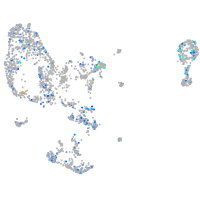
Correlated gene expression
Positive correlation
Negative correlation
Gene
r
Gene
r
stx7l
0.114
si:dkey-251i10.2
-0.049
lpxn
0.100
hbbe1.1
-0.045
si:ch211-165d12.4
0.097
hbbe1.2
-0.040
pcdh20.1
0.097
rbp4l
-0.040
krt95
0.097
gch2
-0.039
znf1069
0.096
CABZ01021592.1
-0.039
si:busm1-180g5.6
0.094
hbbe1.3
-0.038
XLOC-011861
0.093
gstp1
-0.037
XLOC-018977
0.092
zgc:110339
-0.034
LOC110438160
0.090
pvalb2
-0.033
LOC108180727
0.090
uraha
-0.033
atp6ap1a
0.087
cyb5a
-0.032
CU928046.1
0.084
prdx1
-0.032
cdkn1bb
0.082
pts
-0.031
iqcb1
0.082
txn
-0.031
zgc:136767
0.080
si:dkey-151g10.6
-0.030
atp6v0b
0.080
paics
-0.030
si:ch211-167j6.3
0.080
oacyl
-0.030
btr01
0.080
mdh1aa
-0.030
tnni4a
0.079
slc22a7a
-0.028
si:ch211-125e6.5
0.079
XLOC-005350
-0.028
znf1090
0.078
cyb561a3b
-0.028
XLOC-044090
0.078
prdx5
-0.028
f7
0.078
gpd1b
-0.028
zgc:153932
0.076
hbae3
-0.027
gabbr1a
0.076
hbae1.3
-0.026
itln3
0.076
neb
-0.026
ndrg4
0.076
ttn.2
-0.026
si:ch1073-104i17.1
0.076
cmtm3
-0.026
arg1
0.075
mylpfb
-0.025
onecut3b
0.074
aldoab
-0.025
si:dkey-85n7.7
0.074
tmem130
-0.025
si:ch211-288g17.4
0.073
nme2b.2
-0.024
pcdh2ab2
0.073
zgc:153031
-0.024
zgc:109889
0.072
rpl13a
-0.024