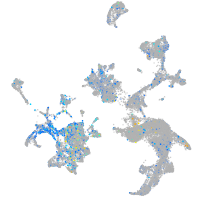
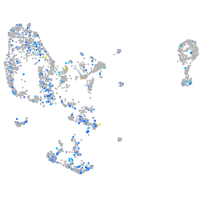
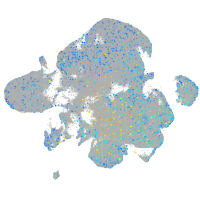
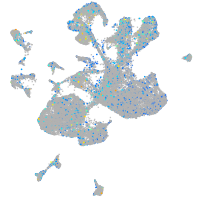
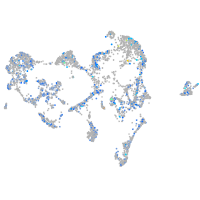
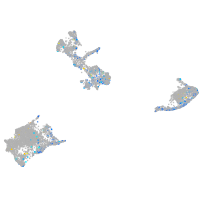
abhydrolase domain containing 17Ab
ZFIN 
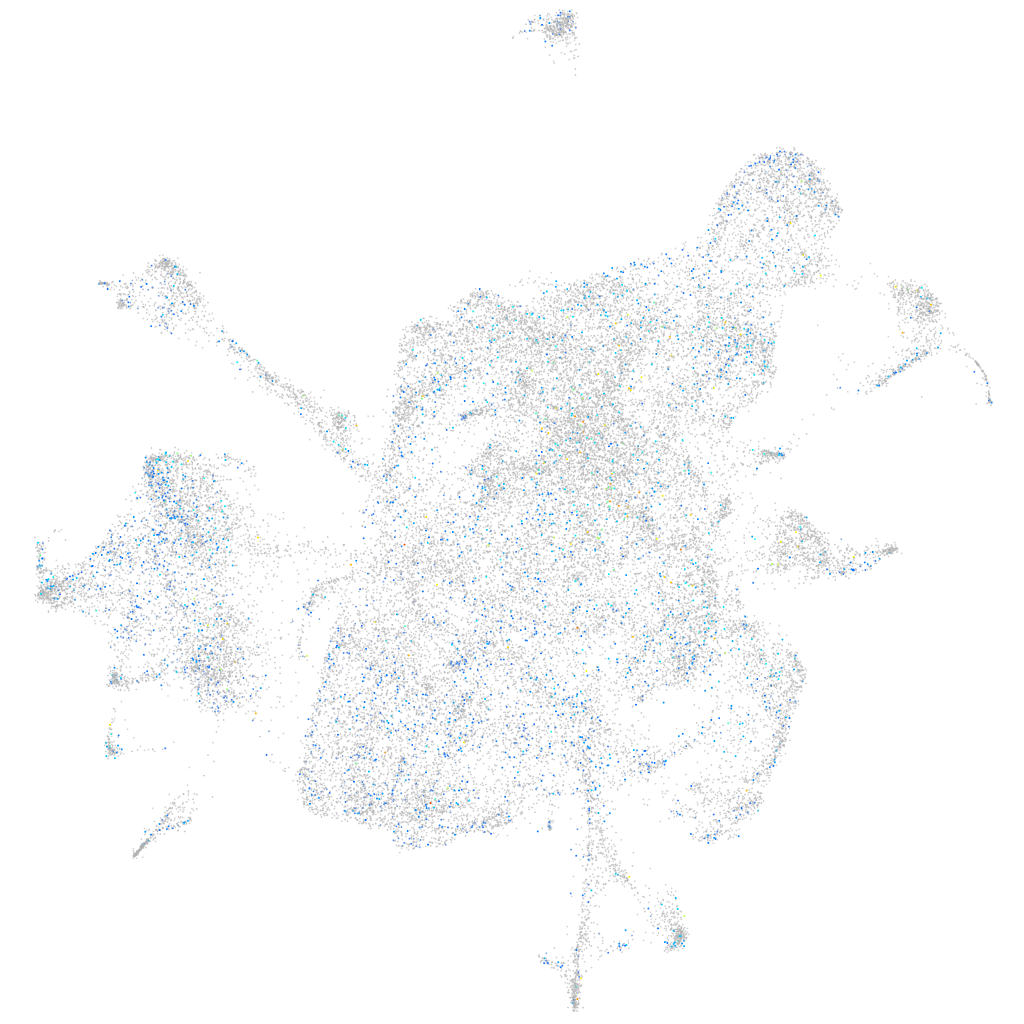
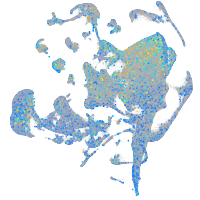
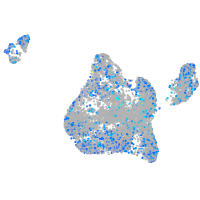
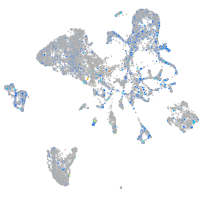
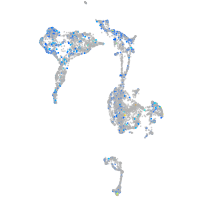
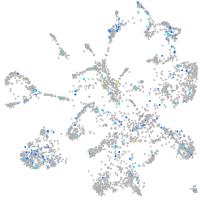
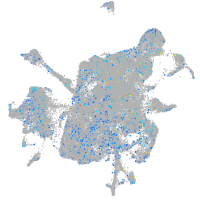
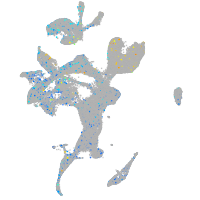
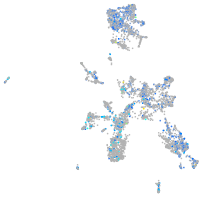
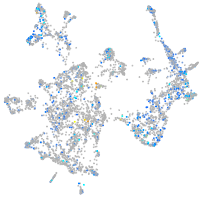
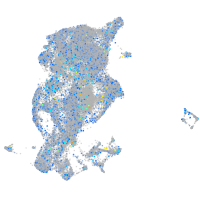
Expression by stage/cluster


Correlated gene expression


| Positive correlation | Negative correlation | ||
| Gene | r | Gene | r |
| calr | 0.055 | si:dkey-151g10.6 | -0.050 |
| ywhah | 0.053 | rplp1 | -0.045 |
| ywhabl | 0.051 | rpl37 | -0.040 |
| pdia3 | 0.050 | rpl39 | -0.039 |
| atrx | 0.050 | rps29 | -0.037 |
| tubb5 | 0.050 | rpl36a | -0.034 |
| ddx5 | 0.049 | rpl38 | -0.033 |
| mt-nd4 | 0.047 | rps21 | -0.033 |
| rnasekb | 0.045 | rps24 | -0.033 |
| gnb1a | 0.045 | rps27a | -0.032 |
| hmgb3a | 0.045 | rpl26 | -0.031 |
| syt2a | 0.045 | rpl29 | -0.029 |
| mt-cyb | 0.045 | rps15a | -0.029 |
| ywhaqb | 0.044 | rps25 | -0.028 |
| fam168a | 0.044 | apoa2 | -0.028 |
| rhoaa | 0.044 | rps28 | -0.027 |
| ammecr1 | 0.044 | rps23 | -0.026 |
| si:ch73-46j18.5 | 0.044 | apoa1b | -0.024 |
| FOXN2 (1 of many) | 0.044 | rps20 | -0.024 |
| zgc:153426 | 0.043 | rps13 | -0.024 |
| ptenb | 0.043 | rps2 | -0.024 |
| hp1bp3 | 0.043 | rps14 | -0.024 |
| stx1b | 0.043 | rbp4 | -0.023 |
| ptp4a1 | 0.043 | rps19 | -0.023 |
| ywhag2 | 0.043 | hgd | -0.023 |
| tubb2b | 0.043 | rpl35 | -0.023 |
| mt-atp6 | 0.043 | rps27.1 | -0.023 |
| marcksl1b | 0.043 | ctrb1 | -0.022 |
| fam117ba | 0.042 | rpl35a | -0.021 |
| gng3 | 0.042 | prss1 | -0.021 |
| rtn1b | 0.042 | rps26l | -0.021 |
| rab14 | 0.042 | hpdb | -0.021 |
| sypb | 0.042 | rpl22 | -0.020 |
| tuba1c | 0.042 | ifitm1 | -0.020 |
| kdm6bb | 0.042 | rpl23 | -0.020 |


