Daniocell
znf1105 (fin)
zinc finger protein 1105
ZFIN
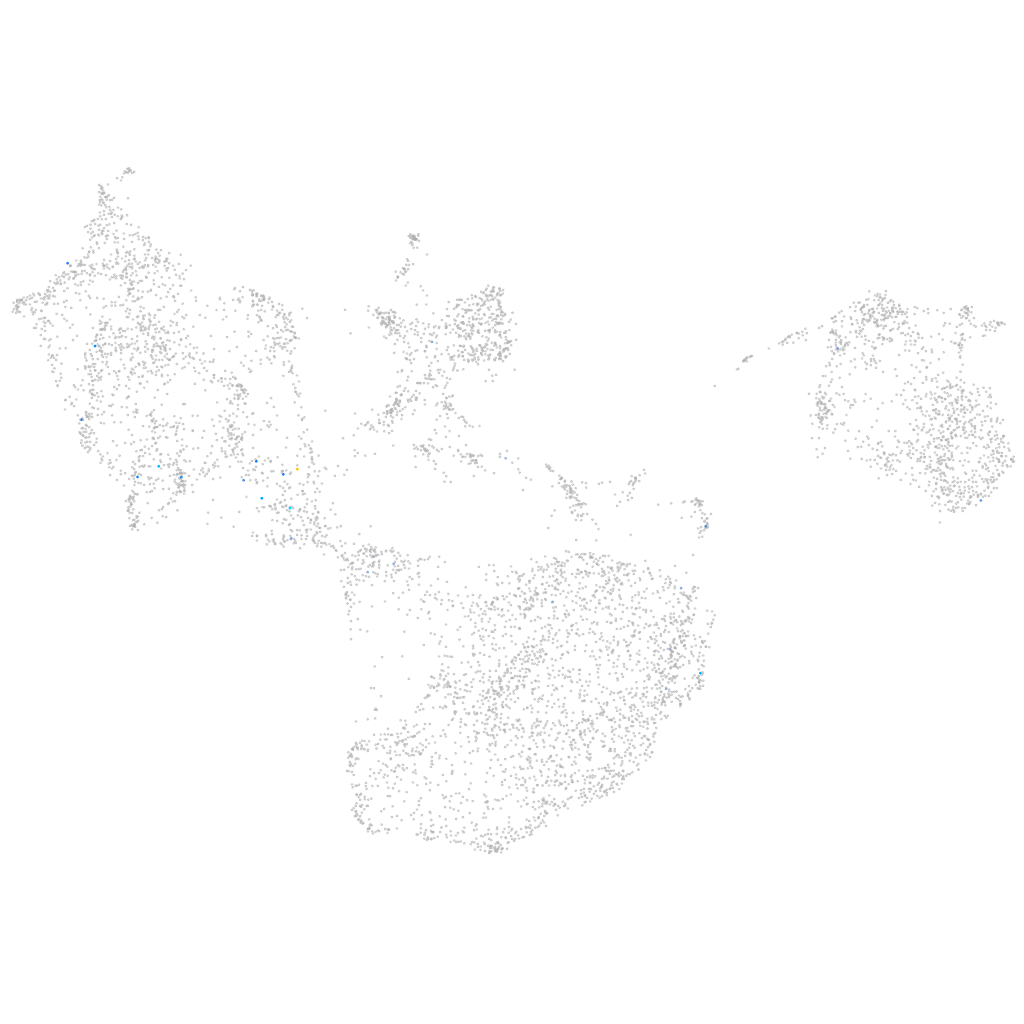
Gene expression UMAP
Display:
Expression
Stage
Other cell groups
all cells
blastomeres
PGCs
endoderm
axial mesoderm
muscle
mural cells /
non-skeletal muscle
mesenchyme
hematopoietic /
vasculature
pronephros
neural
spinal cord / glia
eye
taste / olfactory
otic / lateral line
epidermis
periderm
fin
ionocytes / mucous
pigment cells
Expression by stage/cluster
Correlated gene expression
Positive correlation
Negative correlation
Gene
r
Gene
r
LOC794117
0.268
and2
-0.044
CR407561.1
0.255
icn
-0.038
LOC101884613
0.250
cap1
-0.038
si:dkey-108k21.13
0.233
tmsb4x
-0.037
mettl23
0.213
selenow1
-0.037
si:dkey-264f17.4
0.211
bcam
-0.036
XLOC-042334
0.205
tmsb1
-0.036
si:ch211-246e12.3
0.204
egfl6
-0.036
htr1d
0.202
s100a10b
-0.036
CR855860.2
0.196
cldni
-0.035
zgc:162344
0.188
epcam
-0.035
tmprss5
0.186
cfl1l
-0.035
si:dkey-261m9.6
0.180
myl12.1
-0.035
pstpip1a
0.180
atp5if1b
-0.034
ccr8.1
0.177
ier2b
-0.034
LOC108180322
0.177
cotl1
-0.034
her13
0.176
smdt1b
-0.034
lmod1a
0.171
krt8
-0.033
tspan2b
0.167
lama5
-0.033
msc
0.164
cyt1
-0.033
slc22a6l
0.163
aqp3a
-0.032
si:ch211-113a14.24
0.160
zgc:92380
-0.032
ptcd2
0.153
pfn1
-0.032
XLOC-022150
0.153
col18a1a
-0.032
XLOC-040517
0.152
gabarapa
-0.032
lyrm5b
0.151
lgals3b
-0.032
LOC103909584
0.147
thy1
-0.031
haus1
0.141
and3
-0.031
mtfr1l
0.139
krt4
-0.031
esco2
0.138
tagln2
-0.031
si:ch73-89b15.3
0.137
myh9a
-0.031
si:cabz01036006.1
0.135
si:dkey-102c8.3
-0.030
wdhd1
0.134
ahnak
-0.030
CU459065.1
0.133
arpc3
-0.030
CU638702.1
0.133
zgc:153284
-0.030