Daniocell
zgc:152891 (blastomeres)
zgc:152891
ZFIN
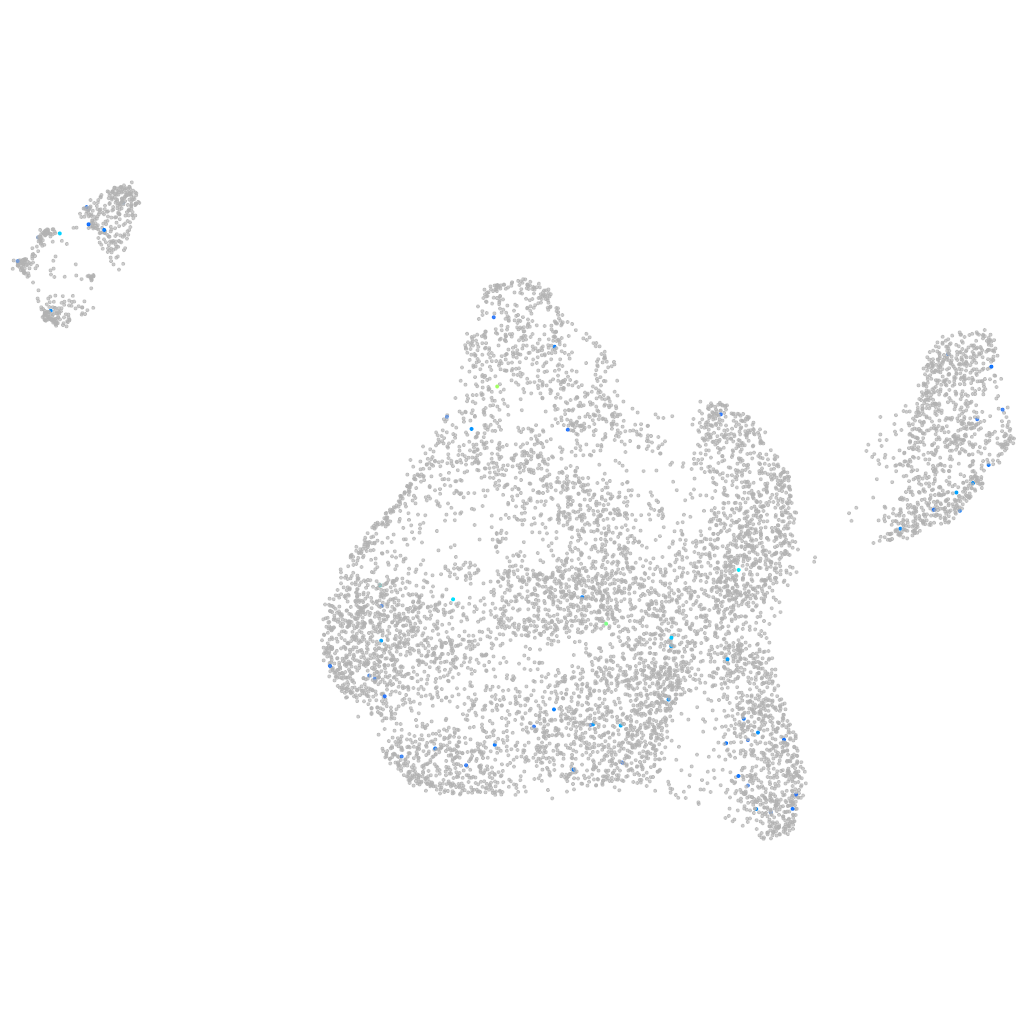
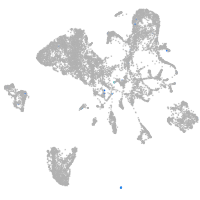
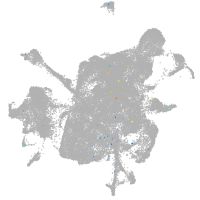
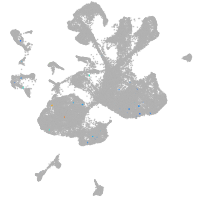
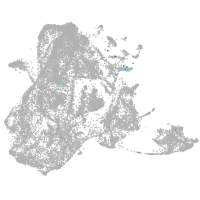
Gene expression UMAP
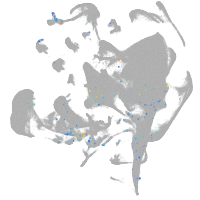
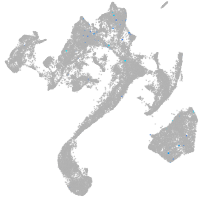
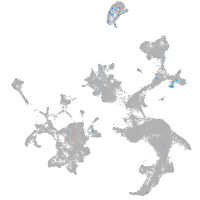
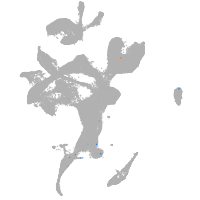
Display:
Expression
Stage
Other cell groups
all cells
blastomeres
PGCs
endoderm
axial mesoderm
muscle
mural cells /
non-skeletal muscle
mesenchyme
hematopoietic /
vasculature
pronephros
neural
spinal cord / glia
eye
taste / olfactory
otic / lateral line
epidermis
periderm
fin
ionocytes / mucous
pigment cells
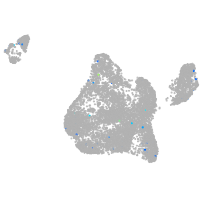
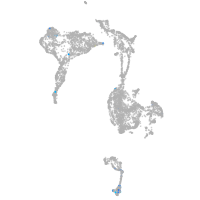
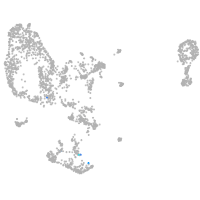
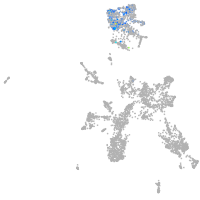
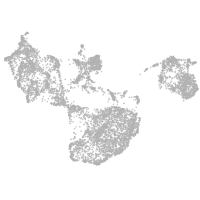
Expression by stage/cluster
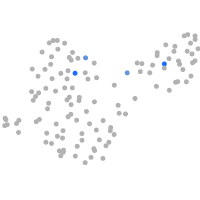
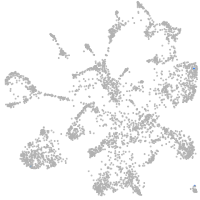
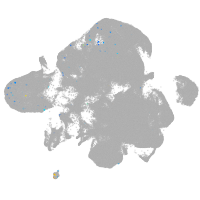
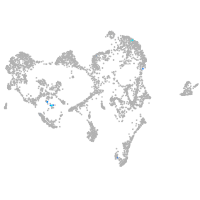
Correlated gene expression
Positive correlation
Negative correlation
Gene
r
Gene
r
LOC103911601
0.272
setb
-0.031
apoa4b.1
0.208
tegt
-0.031
bspry
0.200
rbmx
-0.030
slc19a3a
0.168
snu13a
-0.030
pdk2b
0.168
si:ch211-262h13.3
-0.028
foxi2
0.160
snrpd1
-0.028
LOC101882124
0.154
apela
-0.027
LOC110439419
0.151
rps16
-0.027
CABZ01068177.1
0.148
cdx4
-0.026
FP016005.1
0.148
rpl15
-0.026
XLOC-001683
0.134
acin1a
-0.025
lcp1
0.127
rpl8
-0.025
faslg
0.124
rps15a
-0.025
si:ch211-246i5.5
0.116
rpl32
-0.024
si:ch211-51c14.1
0.111
rpl36a
-0.024
BX957328.1
0.109
cct5
-0.024
CT573316.1
0.109
mrps6
-0.023
adrb1
0.109
ndufb8
-0.023
LOC110438109
0.107
rps20
-0.023
zgc:77748
0.107
thap12a
-0.023
hoxa9b
0.101
bambia
-0.023
BX511034.5
0.099
lmbr1l
-0.023
faim2a
0.099
CABZ01074453.1
-0.023
XLOC-003678
0.095
si:dkey-92i17.2
-0.023
LOC101885117
0.095
pqbp1
-0.023
LOC110439581
0.095
tdg.1
-0.022
htra4
0.095
eve1
-0.022
ndnf
0.095
rps3
-0.022
phactr3b
0.094
brd8
-0.022
anks1b
0.094
RSBN1
-0.022
LOC108181583
0.093
ndufab1a
-0.022
LOC103911067
0.091
rhoab
-0.022
BX294129.1
0.090
si:ch211-114n24.6
-0.022
AL954145.1
0.090
pak1ip1
-0.022
XLOC-021140
0.089
polr2l
-0.022