Daniocell
zgc:103499 (pronephros)
zgc:103499
ZFIN
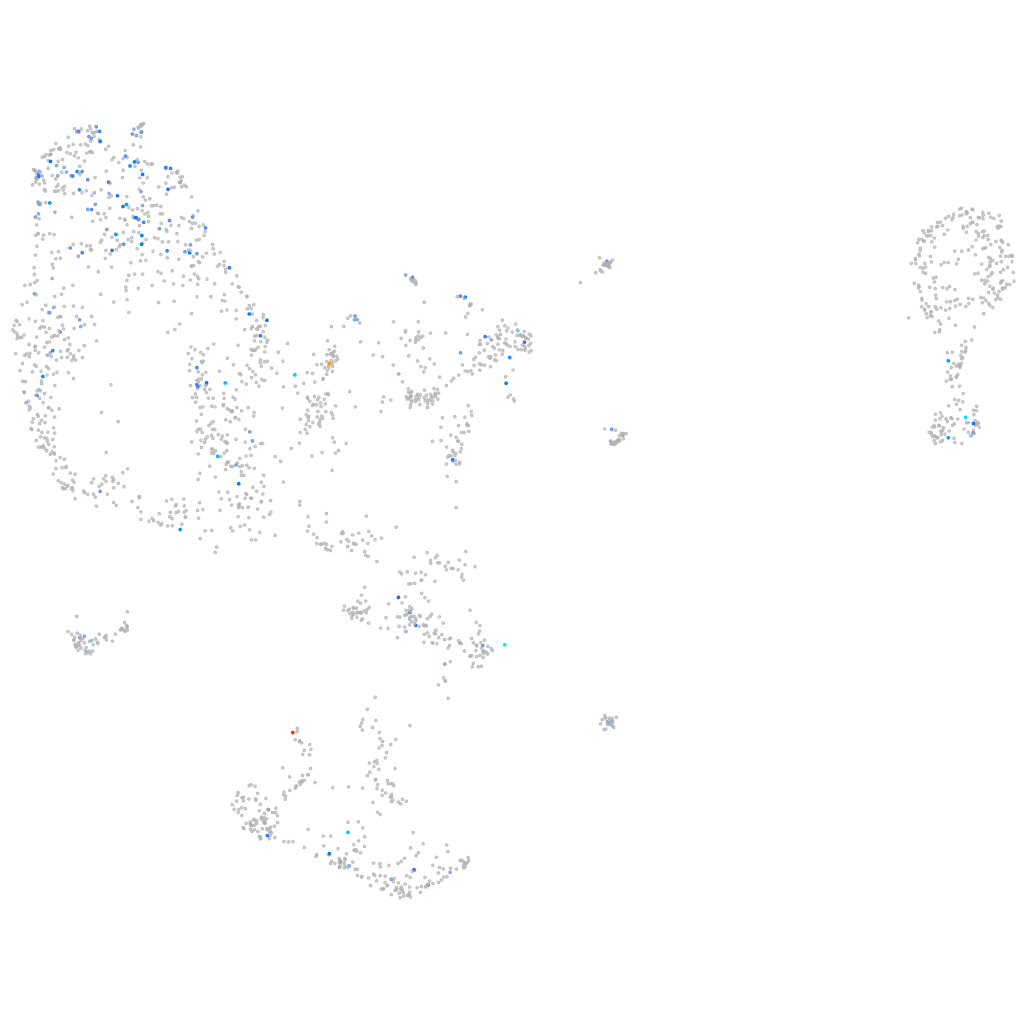
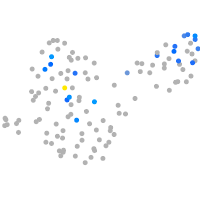
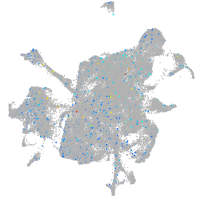
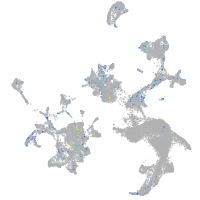
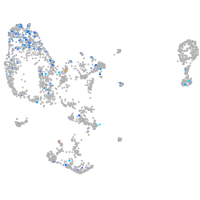
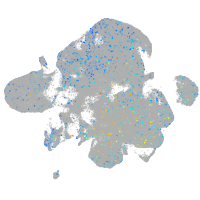
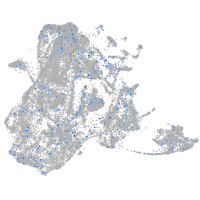
Gene expression UMAP
Display:
Expression
Stage
Other cell groups
all cells
blastomeres
PGCs
endoderm
axial mesoderm
muscle
mural cells /
non-skeletal muscle
mesenchyme
hematopoietic /
vasculature
pronephros
neural
spinal cord / glia
eye
taste / olfactory
otic / lateral line
epidermis
periderm
fin
ionocytes / mucous
pigment cells
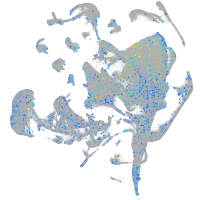
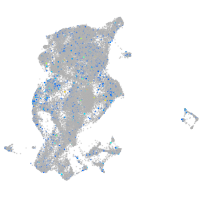
Expression by stage/cluster
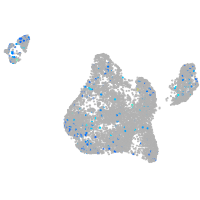
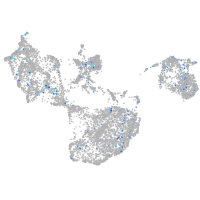
Correlated gene expression
Positive correlation
Negative correlation
Gene
r
Gene
r
LOC108179992
0.328
hmgn6
-0.107
zgc:158366
0.303
si:ch73-1a9.3
-0.102
si:ch211-25d12.7
0.244
id3
-0.090
ogal
0.204
cirbpb
-0.088
gpr185a
0.202
histh1l
-0.087
mpp1
0.196
krt18a.1
-0.086
CABZ01083943.1
0.195
si:dkey-56m19.5
-0.085
tbx21
0.192
txnipa
-0.085
si:ch211-271e10.2
0.191
aldoaa
-0.085
lss
0.190
cfap45
-0.084
znf982
0.190
si:ch73-281n10.2
-0.082
slc34a1a
0.185
hmgb2a
-0.082
si:dkey-33i11.9
0.184
hoxb8a
-0.081
sla1
0.184
h3f3d
-0.081
CDHR1 (1 of many)
0.182
ccdc173
-0.081
epdl2
0.182
rsf1b.1
-0.080
BX088587.1
0.179
marcksl1b
-0.079
rgn
0.179
dpy30
-0.078
BX545856.1
0.178
hmga1a
-0.077
fem1a
0.178
ccdc151
-0.077
CU929144.1
0.177
sparc
-0.076
si:ch73-132f6.5
0.177
marcksb
-0.076
lgmn
0.176
daw1
-0.076
si:ch211-117c9.5
0.175
si:ch211-222l21.1
-0.075
ctsz
0.175
hdac1
-0.074
tpcn1
0.172
msna
-0.074
tbr1b
0.171
morn3
-0.074
slc5a2
0.169
si:ch211-248e11.2
-0.074
slc26a6l
0.168
cldnc
-0.073
afmid
0.168
pax8
-0.072
rprma
0.168
hmga2
-0.072
tsg101b
0.167
hnrnph1l
-0.072
pepd
0.166
zgc:110425
-0.071
slc20a1a
0.165
ribc2
-0.071
gpt2l
0.164
hnrnpa0a
-0.071