Daniocell
zbtb49 (ionocytes / mucous-producing)
zinc finger and BTB domain containing 49
ZFIN
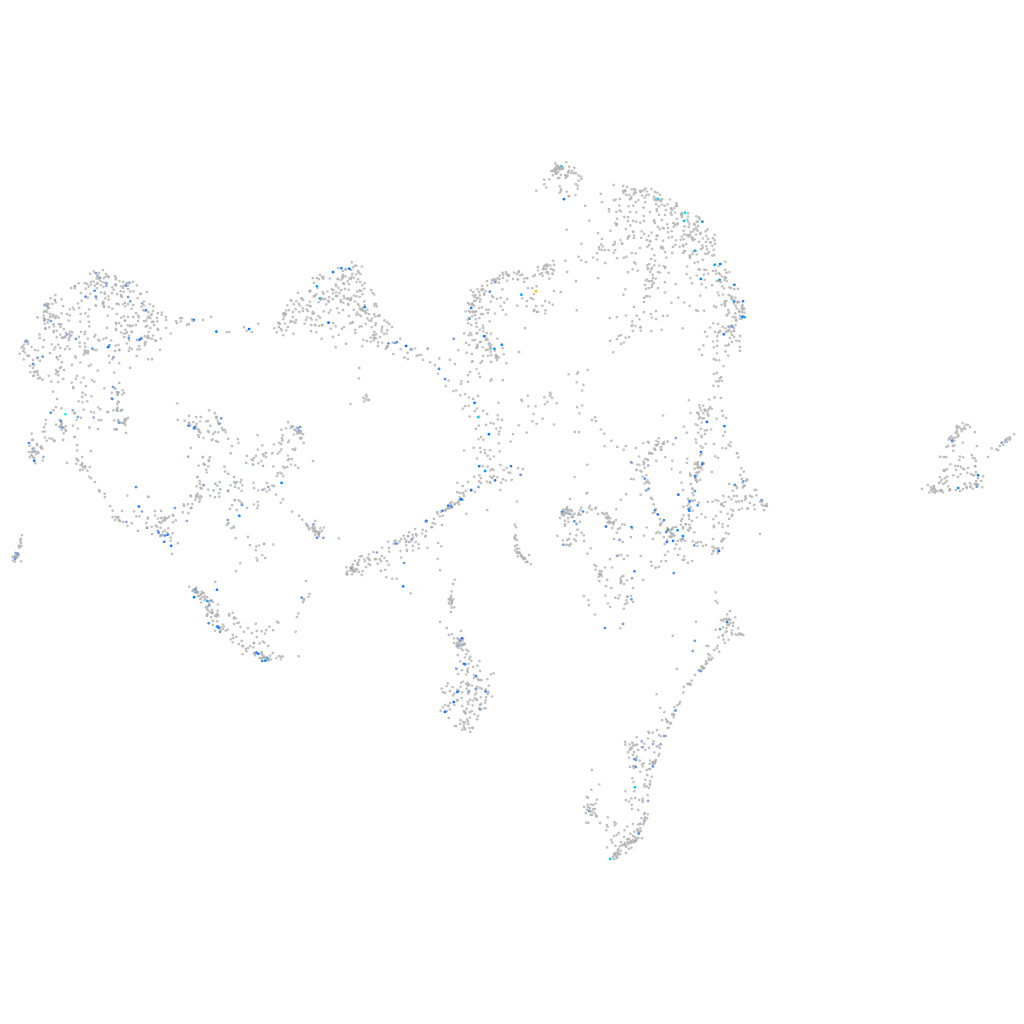
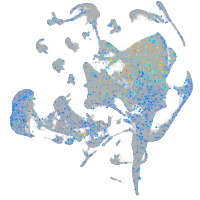
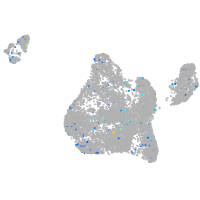
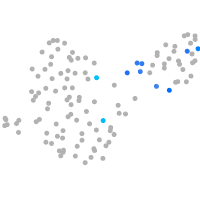
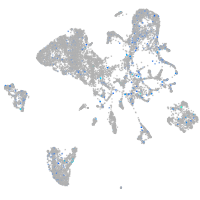
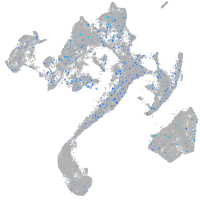
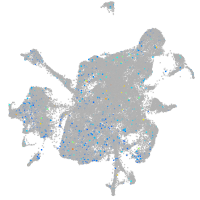
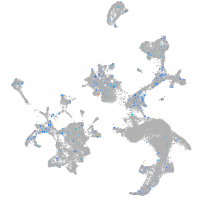
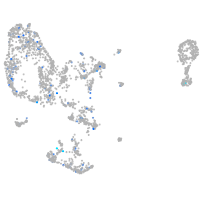
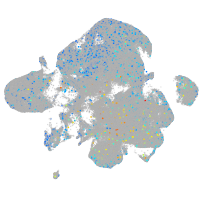
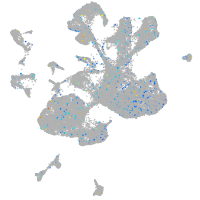
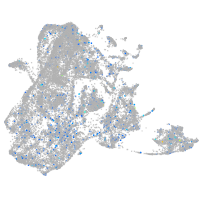
Gene expression UMAP
Display:
Expression
Stage
Other cell groups
all cells
blastomeres
PGCs
endoderm
axial mesoderm
muscle
mural cells /
non-skeletal muscle
mesenchyme
hematopoietic /
vasculature
pronephros
neural
spinal cord / glia
eye
taste / olfactory
otic / lateral line
epidermis
periderm
fin
ionocytes / mucous
pigment cells
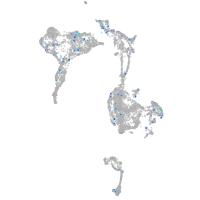
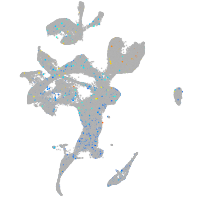
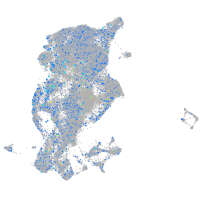
Expression by stage/cluster
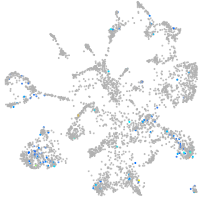
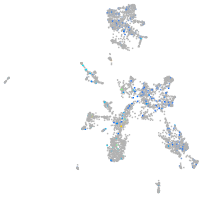
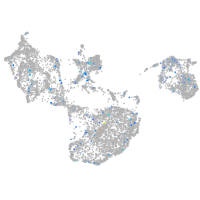
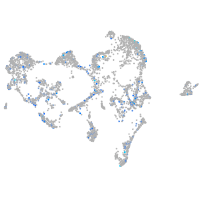
Correlated gene expression
Positive correlation
Negative correlation
Gene
r
Gene
r
hsd17b1
0.224
rpl38
-0.046
wdr95
0.205
thy1
-0.040
lrrc24
0.197
rasef
-0.039
gpsm1b
0.191
cadps2
-0.039
zgc:171501
0.182
aldocb
-0.039
CR388373.2
0.178
si:dkey-199f5.8
-0.038
CU929426.1
0.173
myhz1.1
-0.038
si:ch211-218h8.1
0.170
si:ch211-251p5.5
-0.037
muc5e
0.155
ankdd1b
-0.037
LOC101884799
0.145
si:dkey-151g10.6
-0.036
FO203514.1
0.142
fam107b
-0.036
ERBB4 (1 of many)
0.140
ppiaa
-0.036
dnaaf1
0.136
actc1b
-0.036
BX324003.2
0.134
itpk1b
-0.036
cybb
0.134
kita
-0.036
CU862015.1
0.134
apoeb
-0.035
BX572077.1
0.133
pdk2a
-0.035
LOC101886711
0.129
FAR2
-0.035
LOC110440160
0.125
rpl29
-0.035
zgc:194202
0.125
nupr1b
-0.035
cyp2x12
0.124
cldni
-0.034
lmod1a
0.124
BX936439.1
-0.034
XLOC-025977
0.122
nme3
-0.034
mxd
0.118
si:dkey-11f4.14
-0.034
hcst
0.118
itpka
-0.033
emp1
0.117
rnf19b
-0.033
si:dkey-27j5.10
0.114
grb10b
-0.033
CR847939.1
0.114
lrrc8da
-0.033
syne2a
0.111
muc5.1
-0.033
tmem150c
0.111
wu:fu71h07
-0.033
si:ch211-117n7.7
0.111
si:ch73-306e8.2
-0.033
LOC100002923
0.108
slc1a3a
-0.033
si:ch211-145o7.3
0.107
ak1
-0.033
LOC100150116
0.107
tyms
-0.033
olig1
0.105
gdpd2
-0.033