Daniocell
xk (mural cells / non-skeletal muscle)
X-linked Kx blood group (McLeod syndrome)
ZFIN
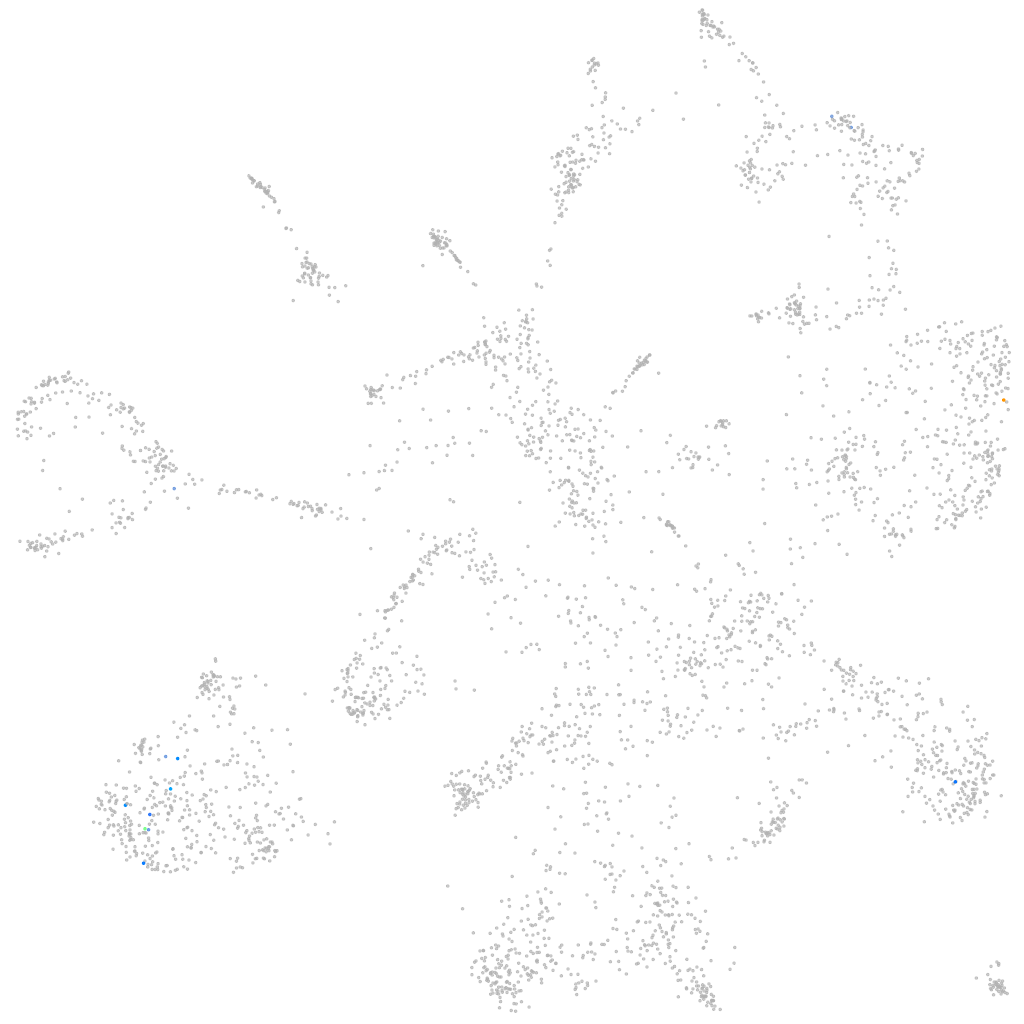
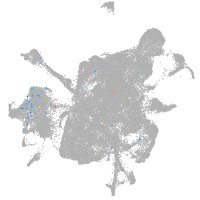
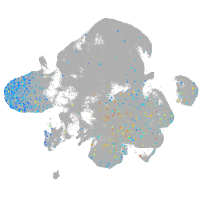
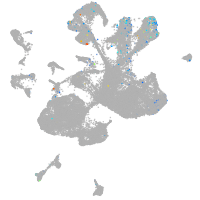
Gene expression UMAP
Display:
Expression
Stage
Other cell groups
all cells
blastomeres
PGCs
endoderm
axial mesoderm
muscle
mural cells /
non-skeletal muscle
mesenchyme
hematopoietic /
vasculature
pronephros
neural
spinal cord / glia
eye
taste / olfactory
otic / lateral line
epidermis
periderm
fin
ionocytes / mucous
pigment cells
Expression by stage/cluster
Correlated gene expression
Positive correlation
Negative correlation
Gene
r
Gene
r
unc119.2
0.690
actb2
-0.066
LOC101885484
0.609
rps4x
-0.060
LOC108182766
0.453
actb1
-0.052
si:ch1073-82l19.1
0.453
zgc:153867
-0.045
XLOC-023624
0.434
tpm4a
-0.044
dnaaf2
0.431
ppib
-0.040
CNNM1
0.369
rps17
-0.039
LOC108183423
0.338
mfap2
-0.038
rasd3
0.302
tmsb4x
-0.037
viml
0.276
cd63
-0.037
si:ch211-246b8.5
0.272
rps27a
-0.036
dpp4
0.269
naca
-0.036
CU928129.1
0.260
zgc:162730
-0.035
LOC101882875
0.258
flna
-0.035
si:dkeyp-72h1.1
0.258
col5a2a
-0.034
ano2
0.255
tln1
-0.032
rab27b
0.254
si:ch211-286o17.1
-0.031
BX005417.1
0.245
msna
-0.031
si:dkey-24p1.7
0.238
junba
-0.031
LOC108179567
0.237
ahnak
-0.031
si:ch211-189a15.5
0.236
aoc2
-0.030
grm6a
0.231
krt4
-0.030
c15h3orf80
0.227
xbp1
-0.030
acbd5b
0.227
myl9b
-0.030
CABZ01012885.1
0.227
serf2
-0.030
nceh1b.1
0.227
fosab
-0.029
irx1b
0.221
flot2a
-0.029
fam78ab
0.218
anxa11b
-0.029
zgc:113340
0.216
cnn2
-0.029
si:dkey-240n22.3
0.211
col6a1
-0.029
btbd3b
0.210
cavin1b
-0.028
LOC100005864
0.206
LOC110439372
-0.028
XLOC-004991
0.205
BX088707.3
-0.028
si:dkey-58f10.6
0.205
lxn
-0.028
slc16a4
0.203
tmem167a
-0.028