Daniocell
wu:fj13e08 (axial mesoderm)
wu:fj13e08
ZFIN
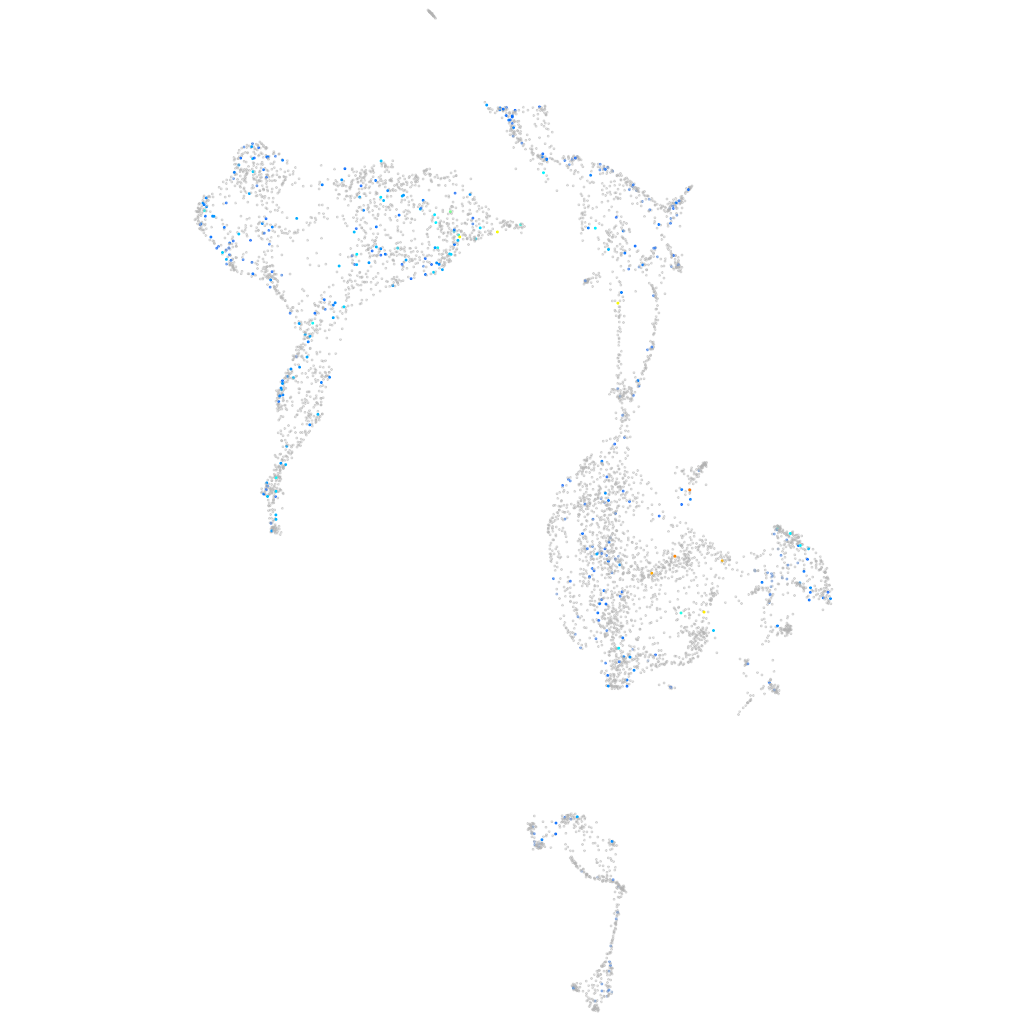
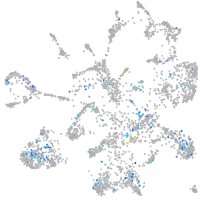
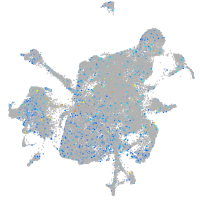
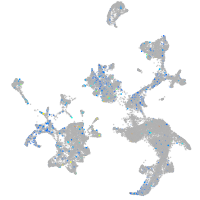
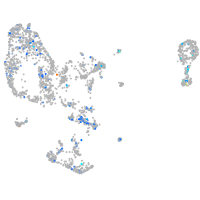
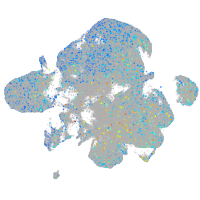
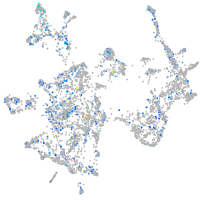
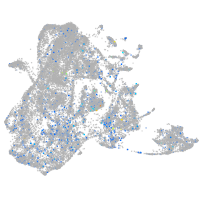
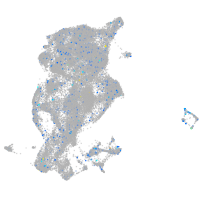
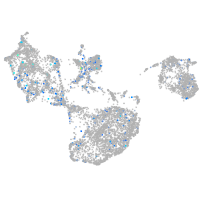
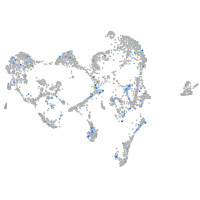
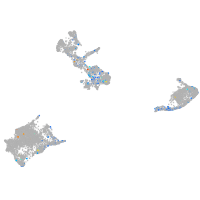
Gene expression UMAP
Display:
Expression
Stage
Other cell groups
all cells
blastomeres
PGCs
endoderm
axial mesoderm
muscle
mural cells /
non-skeletal muscle
mesenchyme
hematopoietic /
vasculature
pronephros
neural
spinal cord / glia
eye
taste / olfactory
otic / lateral line
epidermis
periderm
fin
ionocytes / mucous
pigment cells
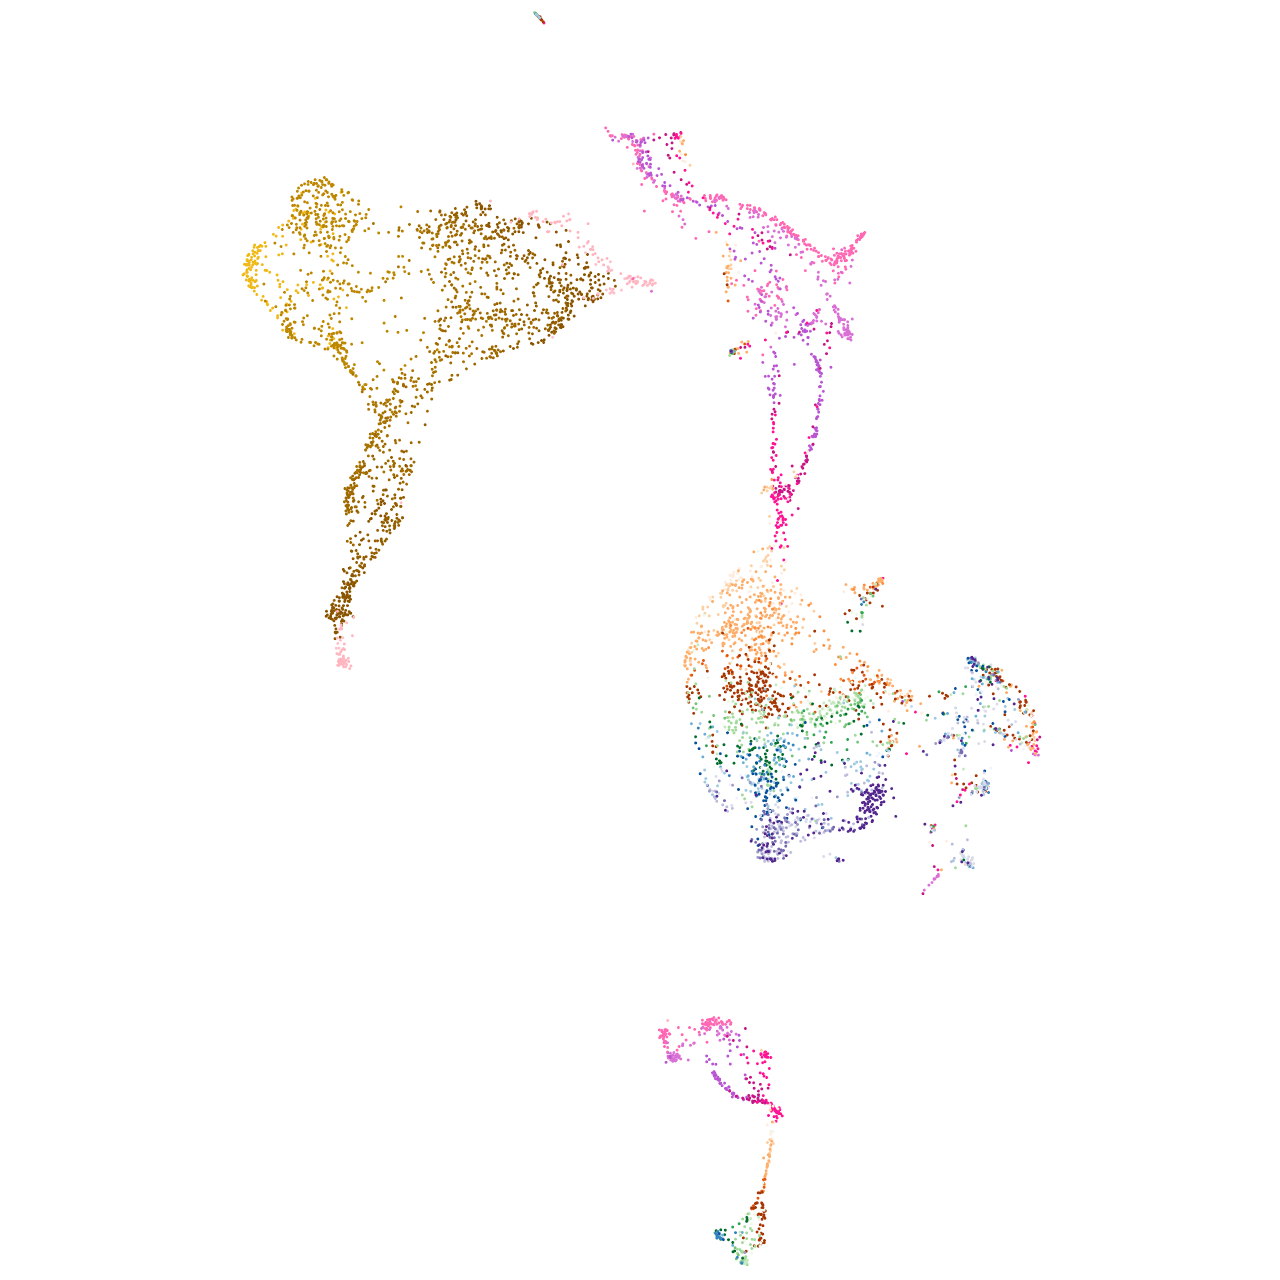
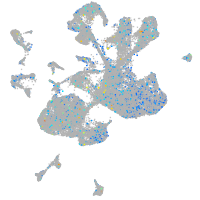
Expression by stage/cluster
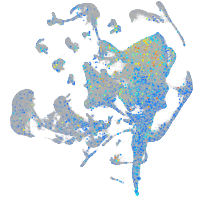
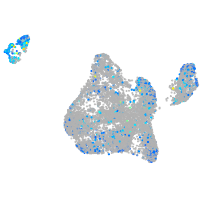
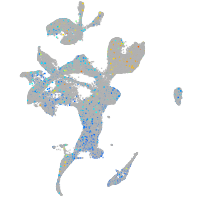
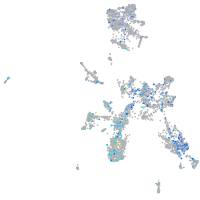
Correlated gene expression
Positive correlation
Negative correlation
Gene
r
Gene
r
LOC108179280
0.170
krt8
-0.083
erbb4b
0.125
rpl37
-0.079
CT573408.1
0.119
zgc:158463
-0.075
mir20a
0.118
rps10
-0.074
lrrtm4l1
0.114
si:ch73-23l24.1
-0.074
si:ch211-131k2.3
0.112
cnmd
-0.074
zgc:114175
0.110
col2a1a
-0.073
adcy1b
0.106
zgc:114188
-0.073
mei4
0.105
zmp:0000000760
-0.072
ADGRL3
0.097
col11a2
-0.072
ncl
0.095
col9a1b
-0.072
hnrnpl
0.095
col11a1a
-0.071
si:ch73-359m17.5
0.095
col9a2
-0.070
syncrip
0.094
CABZ01072614.1
-0.070
si:ch211-226h7.5
0.094
sparc
-0.070
LOC101882529
0.094
col9a3
-0.069
ilf2
0.094
cmn
-0.069
hnrnpabb
0.094
rps17
-0.067
GPR45
0.094
zgc:113232
-0.067
LOC100004160
0.093
snorc
-0.067
si:dkey-33c12.3
0.093
epyc
-0.067
anp32e
0.092
tgfbi
-0.066
etv5b
0.091
krt18a.1
-0.066
ilf3b
0.091
cavin2b
-0.065
snrpc
0.090
LO018188.1
-0.065
hnrnpaba
0.090
matn4
-0.065
snrpd3l
0.090
ucmab
-0.064
BX649350.1
0.089
slc7a8a
-0.063
sap30bp
0.089
CR383676.1
-0.063
scaf1
0.089
tgfb3
-0.062
lrfn2b
0.089
matn3b
-0.061
LOC110439713
0.089
si:ch211-243g18.2
-0.060
hdac1
0.089
cd81a
-0.060
cdc25b
0.089
cd99
-0.060
rrs1
0.089
gas2b
-0.059