Daniocell
wdtc1 (pronephros)
WD and tetratricopeptide repeats 1
ZFIN
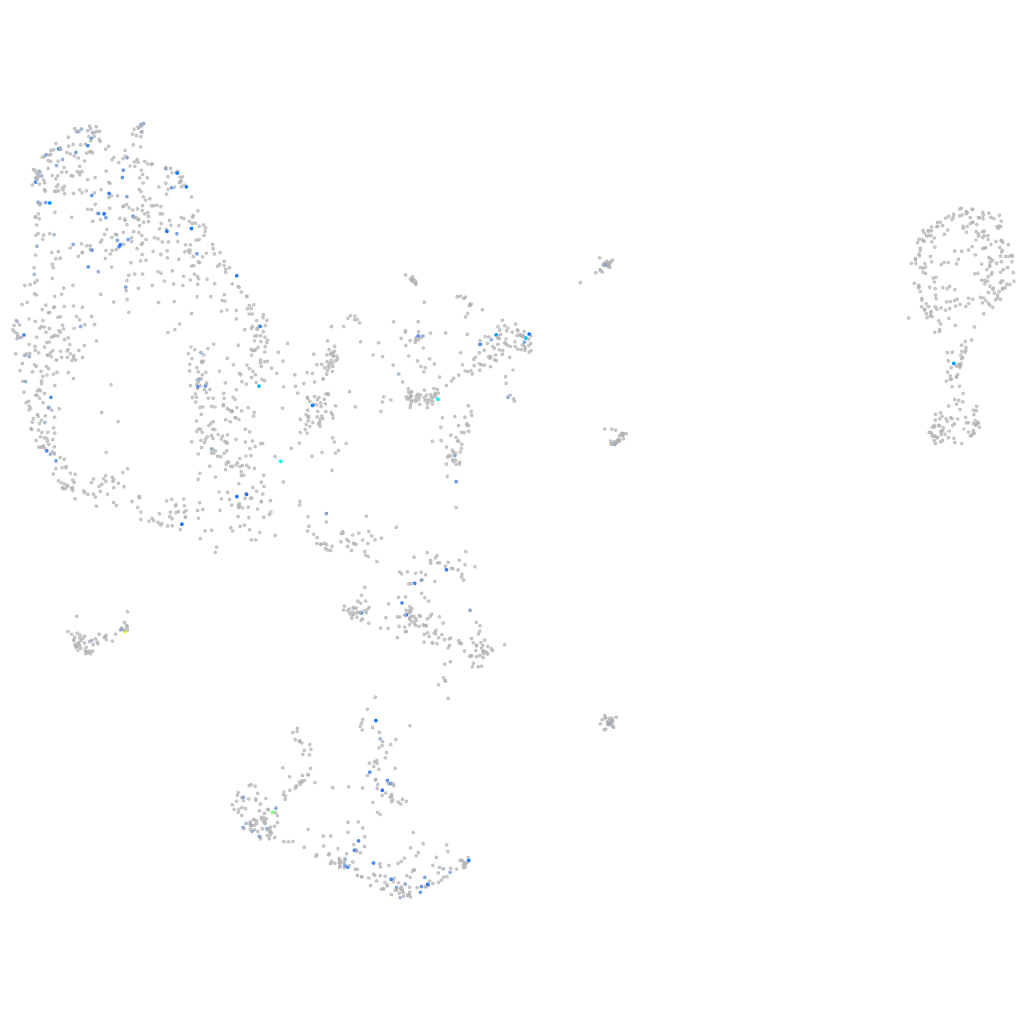
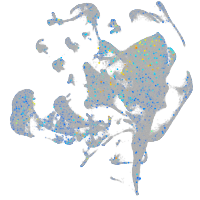
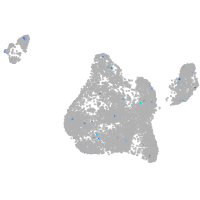
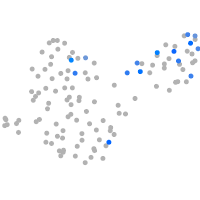
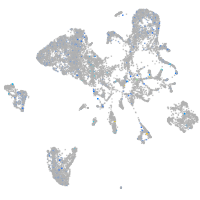
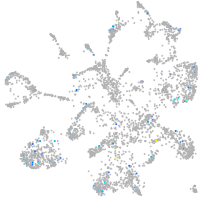
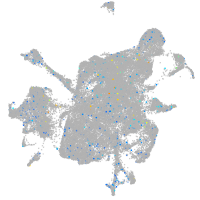
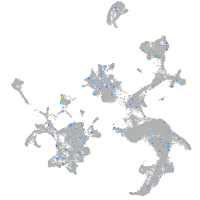
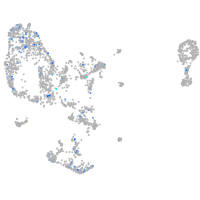
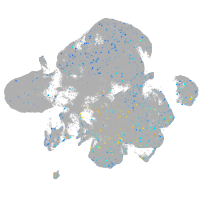
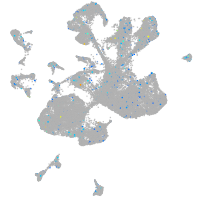
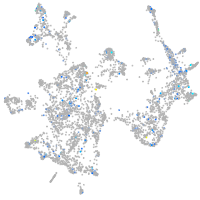
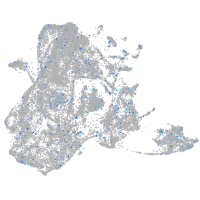
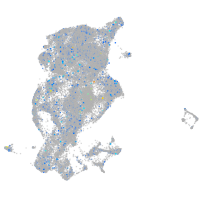
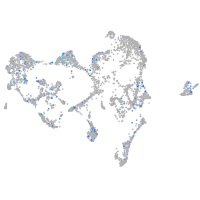
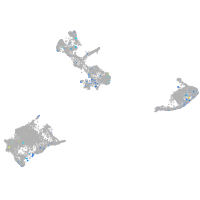
Gene expression UMAP
Display:
Expression
Stage
Other cell groups
all cells
blastomeres
PGCs
endoderm
axial mesoderm
muscle
mural cells /
non-skeletal muscle
mesenchyme
hematopoietic /
vasculature
pronephros
neural
spinal cord / glia
eye
taste / olfactory
otic / lateral line
epidermis
periderm
fin
ionocytes / mucous
pigment cells
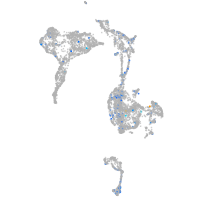
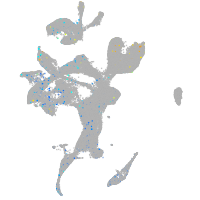
Expression by stage/cluster
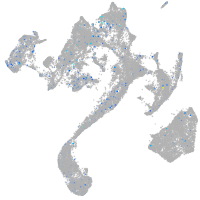
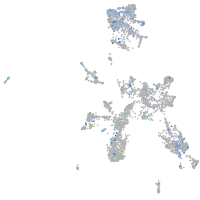
Correlated gene expression
Positive correlation
Negative correlation
Gene
r
Gene
r
LOC101886896
0.308
serbp1a
-0.093
si:cabz01069015.1
0.308
hspb1
-0.078
mir199-2
0.243
apoeb
-0.077
lactbl1a
0.243
si:ch73-1a9.3
-0.077
si:ch211-130h14.4
0.238
wu:fb97g03
-0.077
tmprss3a
0.231
setb
-0.076
LOC101885256
0.223
hnrnpaba
-0.074
sall1b
0.223
acin1a
-0.070
arl13a
0.213
nop56
-0.070
LOC110438375
0.209
syncrip
-0.070
hoxc12a
0.207
marcksb
-0.068
nars2
0.204
h3f3d
-0.068
CABZ01053748.1
0.204
CT030188.1
-0.068
LOC110438054
0.199
tardbp
-0.068
si:ch211-191i18.4
0.196
apoc1
-0.067
BEND4
0.193
ebna1bp2
-0.067
si:dkey-220f10.4
0.190
cbx3a
-0.067
tmem237a
0.188
prkrip1
-0.066
si:ch211-81a5.1
0.187
hmgn6
-0.066
kcnh1b
0.184
npm1a
-0.065
cplx3b
0.183
akap12b
-0.065
trpc1
0.181
rsl1d1
-0.064
ttc16
0.180
ddx18
-0.064
sez6a
0.179
snrnp70
-0.064
fam169b
0.177
cdx4
-0.062
LOC103910100
0.171
phf5a
-0.062
kcnq2b
0.170
ngdn
-0.062
spire1b
0.170
lyar
-0.061
LOC101883789
0.168
cxcl12a
-0.061
tmppe
0.168
tmpoa
-0.061
LOC103910763.1
0.166
ncl
-0.060
nt5c1ba
0.166
fbl
-0.060
cd226
0.164
dkc1
-0.060
tac3a
0.163
rpl7a
-0.060
si:ch73-138e16.4
0.162
cx43.4
-0.059