Daniocell
vps53 (mural cells / non-skeletal muscle)
VPS53 subunit of GARP complex
ZFIN
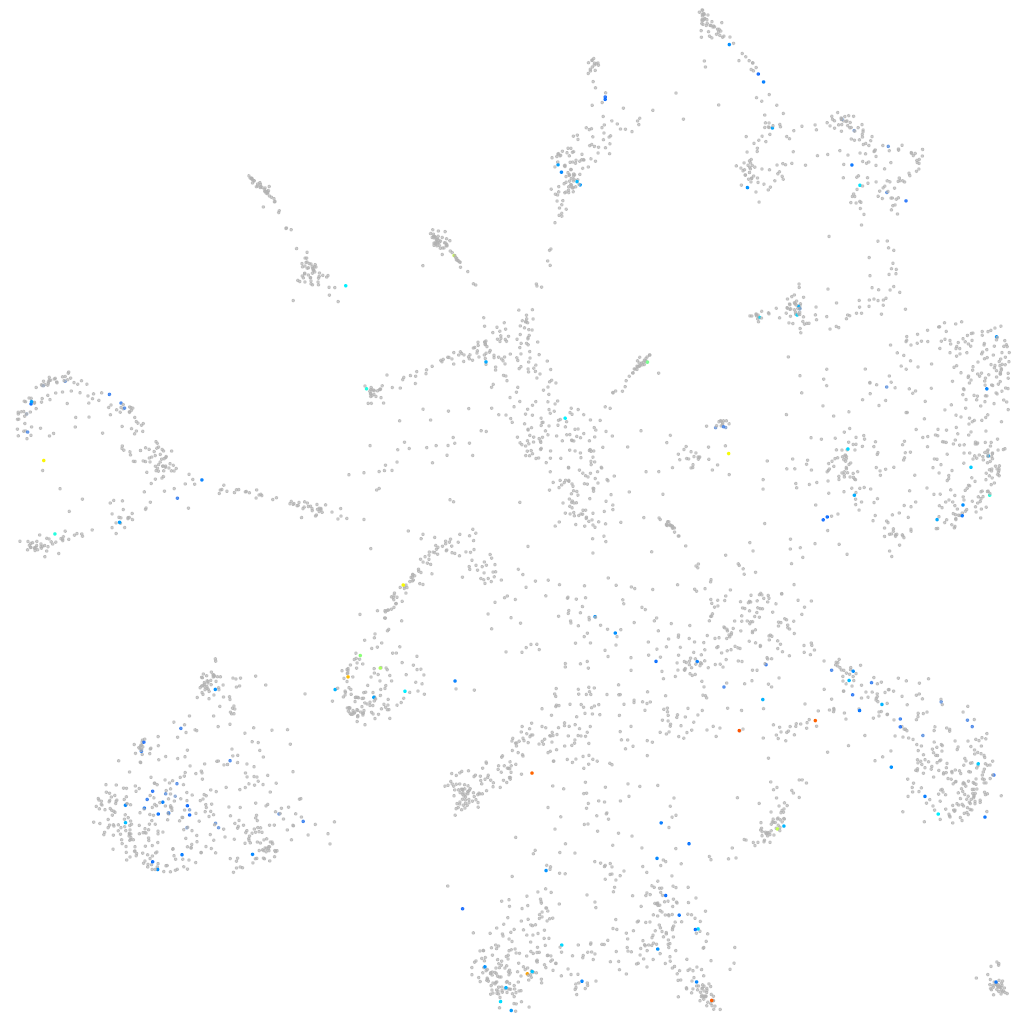
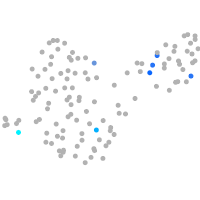
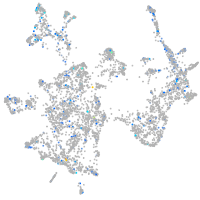
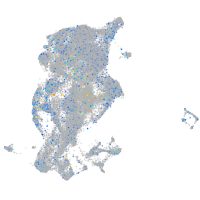
Gene expression UMAP
Display:
Expression
Stage
Other cell groups
all cells
blastomeres
PGCs
endoderm
axial mesoderm
muscle
mural cells /
non-skeletal muscle
mesenchyme
hematopoietic /
vasculature
pronephros
neural
spinal cord / glia
eye
taste / olfactory
otic / lateral line
epidermis
periderm
fin
ionocytes / mucous
pigment cells
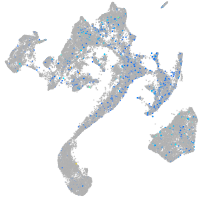
Expression by stage/cluster
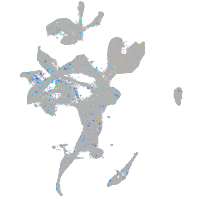
Correlated gene expression
Positive correlation
Negative correlation
Gene
r
Gene
r
syn3
0.227
ednraa
-0.045
CT573103.1
0.221
rps12
-0.044
LOC101884237
0.198
rps11
-0.041
si:dkey-102g19.3
0.189
si:ch211-251b21.1
-0.040
CU459094.1
0.165
si:dkey-40c11.2
-0.039
zgc:194275
0.151
zeb2a
-0.039
itprid1
0.147
rplp2
-0.039
si:ch211-59h6.1
0.145
pkdcca
-0.039
CR388148.2
0.145
pdgfrb
-0.039
si:ch211-288g17.4
0.142
kctd12.2
-0.039
jakmip3
0.140
slc38a5b
-0.038
zgc:56622
0.140
rem1
-0.037
si:ch1073-443f11.2
0.138
ctbp2a
-0.037
LOC101886078
0.135
si:ch211-286o17.1
-0.036
igfbp6b
0.134
mgst1.2
-0.036
si:dkey-9i23.4
0.134
tfdp2
-0.035
c1qtnf9
0.133
rpl19
-0.034
scn4bb
0.129
rbm5
-0.034
LOC101883798
0.128
rpl32
-0.033
ankrd9
0.126
zgc:77849
-0.033
kcnj5
0.125
rpl30
-0.032
slc6a18
0.124
adgrl2a
-0.032
LOC101884966
0.122
zfp36l1b
-0.032
gbe1a
0.121
gchfr
-0.032
def6a
0.120
fzd4
-0.031
mfap4
0.118
lpar2a
-0.031
si:zfos-741a10.3
0.115
rps14
-0.031
caprin2
0.112
c6
-0.031
nmbr
0.112
abhd2b
-0.030
si:ch73-151m17.5
0.112
jdp2b
-0.030
elovl2
0.111
antxr2a
-0.030
XLOC-020459
0.109
si:ch73-376l24.2
-0.030
itgam
0.107
CELA1 (1 of many)
-0.029
cipca
0.107
sik3
-0.029
LOC100536469
0.106
oaz2a
-0.029