Daniocell
vps33b (ionocytes / mucous-producing)
VPS33B late endosome and lysosome associated
ZFIN
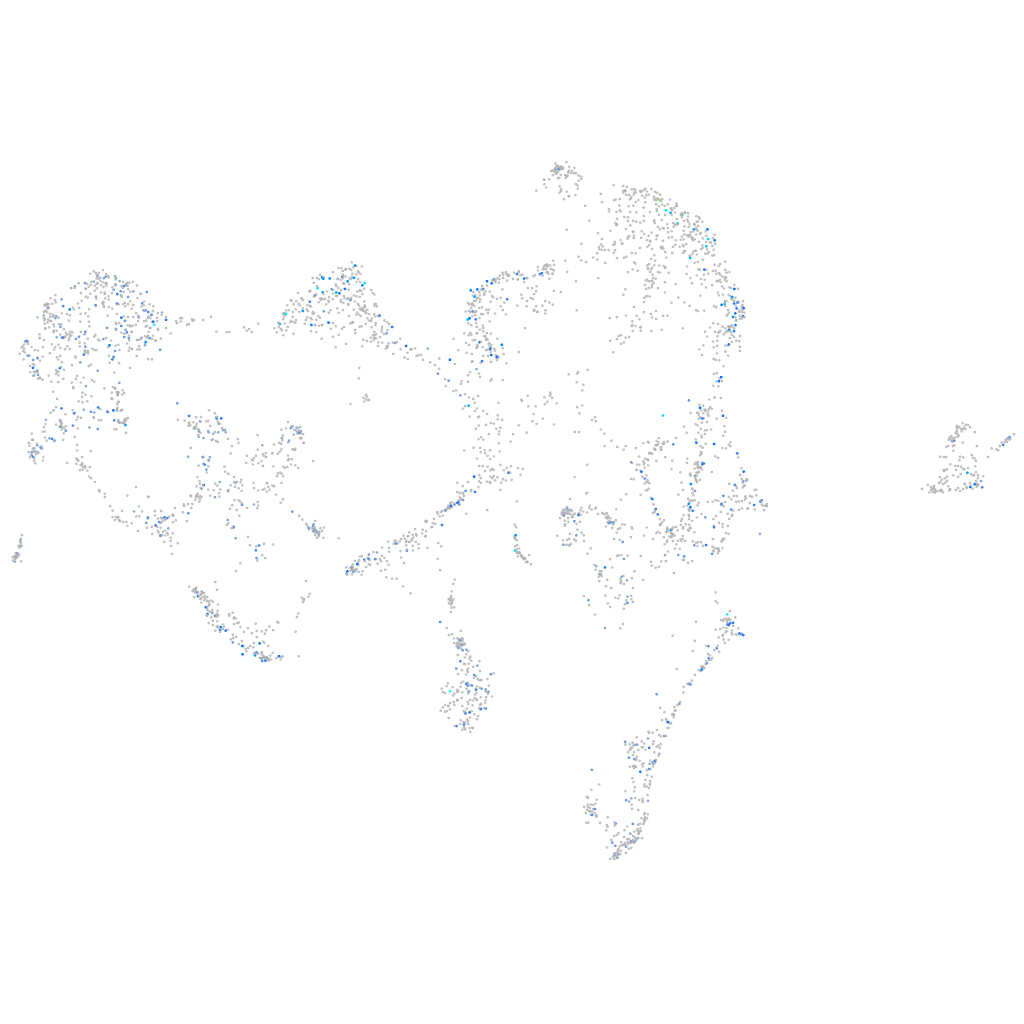
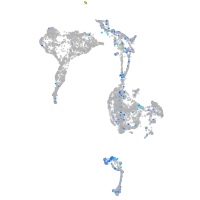
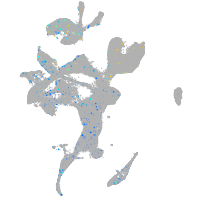
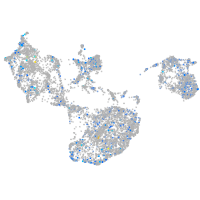
Gene expression UMAP
Display:
Expression
Stage
Other cell groups
all cells
blastomeres
PGCs
endoderm
axial mesoderm
muscle
mural cells /
non-skeletal muscle
mesenchyme
hematopoietic /
vasculature
pronephros
neural
spinal cord / glia
eye
taste / olfactory
otic / lateral line
epidermis
periderm
fin
ionocytes / mucous
pigment cells
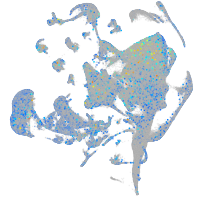
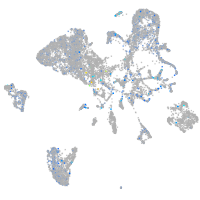
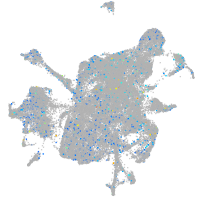
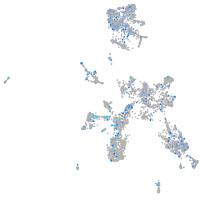
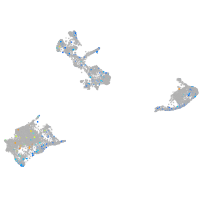
Expression by stage/cluster
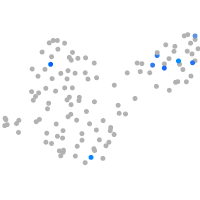
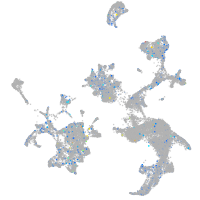
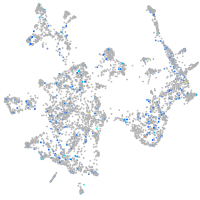
Correlated gene expression
Positive correlation
Negative correlation
Gene
r
Gene
r
LOC101883398
0.135
zgc:158463
-0.058
si:ch211-250e5.16
0.128
CR383676.1
-0.049
tbkbp1
0.125
rpl38
-0.048
LOC110439438
0.123
rpl37
-0.046
paqr4b
0.116
snrkb
-0.043
CR847850.1
0.115
ctrb1
-0.043
si:dkey-121h17.7
0.112
rps28
-0.043
XLOC-003052
0.111
tfr1a
-0.043
CR376740.1
0.111
nectin1b
-0.043
XLOC-029036
0.109
plpp3
-0.042
LOC103909899
0.109
mylpfa
-0.042
LOC108179139
0.108
si:ch73-367p23.2
-0.042
LOC100536192
0.107
LOC110439372
-0.042
tmtops2a
0.106
hnrnpr
-0.041
LOC110439474
0.103
ergic1
-0.041
XLOC-009525
0.102
kita
-0.041
si:dkey-172m14.2
0.101
myhz1.1
-0.039
LOC108181097
0.101
ttc7a
-0.039
CR450808.2
0.101
cx43
-0.039
LOC108179356
0.101
muc5.1
-0.038
XLOC-043071
0.101
si:dkey-151g10.6
-0.038
myrfl
0.098
pvalb2
-0.038
si:dkey-16i5.8
0.098
CABZ01080702.1
-0.038
CU104741.1
0.098
nfia
-0.037
adipor2
0.098
pitx1
-0.037
wisp1a
0.096
eva1a
-0.037
chmp4c
0.095
CABZ01072614.1
-0.037
si:ch211-195b11.3
0.095
tle2b
-0.037
zgc:153968
0.095
gpx3
-0.037
LOC100004978
0.095
foxi2
-0.037
strap
0.094
zgc:112160
-0.036
FO704721.2
0.094
tnnt3b
-0.036
vamp8
0.093
chd4a
-0.036
si:dkey-71d15.2
0.093
b3gnt7
-0.036
cldn2
0.093
muc5.2
-0.036