Daniocell
vmo1b (pronephros)
vitelline membrane outer layer 1 homolog b
ZFIN
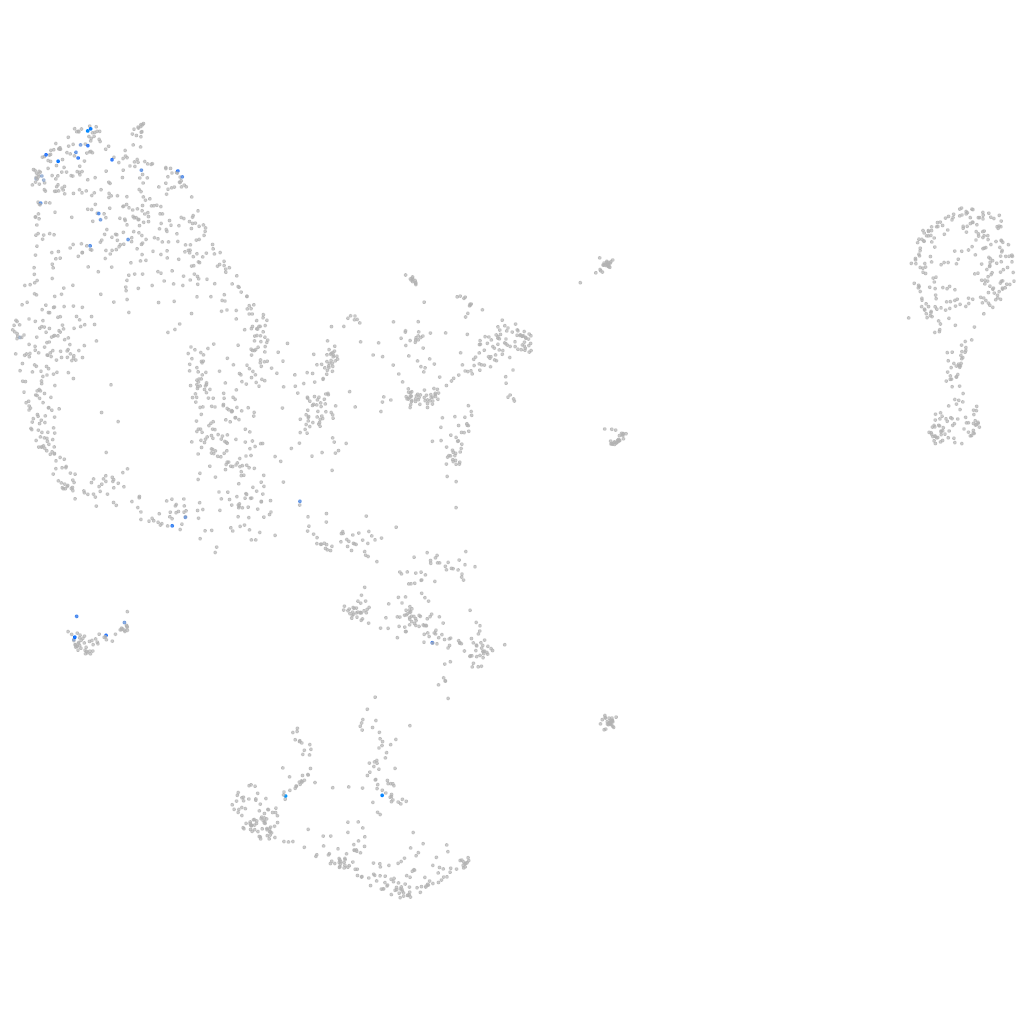
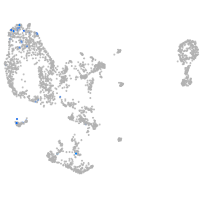
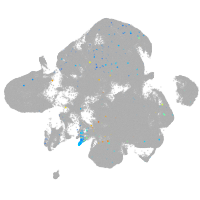
Gene expression UMAP
Display:
Expression
Stage
Other cell groups
all cells
blastomeres
PGCs
endoderm
axial mesoderm
muscle
mural cells /
non-skeletal muscle
mesenchyme
hematopoietic /
vasculature
pronephros
neural
spinal cord / glia
eye
taste / olfactory
otic / lateral line
epidermis
periderm
fin
ionocytes / mucous
pigment cells
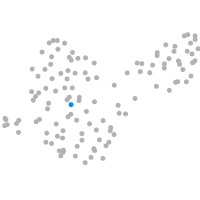
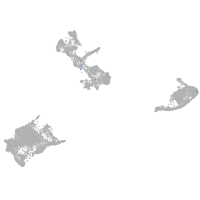
Expression by stage/cluster
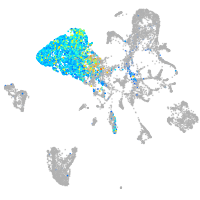
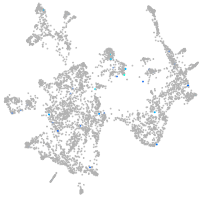
Correlated gene expression
Positive correlation
Negative correlation
Gene
r
Gene
r
ankrd33bb
0.290
marcksl1b
-0.067
LOC103911653
0.290
hmgn7
-0.067
LOC103911003
0.290
ptmab
-0.066
AL954149.1
0.280
ilf3b
-0.064
ccl39.5
0.280
srrm1
-0.064
LOC103910439
0.280
nucks1a
-0.063
CU633823.1
0.258
hmgb1b
-0.063
BX914197.1
0.258
hnrnpa0a
-0.061
ahsg2
0.243
h3f3d
-0.061
zgc:171470
0.243
hmgb3a
-0.060
CABZ01025780.1
0.243
setb
-0.060
si:ch73-15n24.1
0.243
hnrnpaba
-0.060
LOC101885444
0.241
seta
-0.059
LOC103910489
0.238
si:ch211-222l21.1
-0.059
si:ch211-262h13.5
0.231
marcksb
-0.059
f7
0.226
hnrnpa1a
-0.059
comtd1
0.224
si:ch73-281n10.2
-0.059
c3a.5
0.224
hmgn6
-0.058
aqp12
0.218
cbx3a
-0.058
cp
0.216
hmga1a
-0.058
cpb2
0.215
prmt1
-0.057
sod3a
0.212
si:ch73-1a9.3
-0.057
si:ch211-170d8.5
0.207
hnrnpabb
-0.056
si:dkey-105h12.2
0.205
anp32a
-0.056
nr2e3
0.205
hmgb2a
-0.055
LOC103911209
0.205
acin1a
-0.055
LOC103911517
0.205
cbx5
-0.054
ahsg1
0.203
id3
-0.054
si:dkeyp-73d8.9
0.203
eif4a1a
-0.054
fetub
0.201
smarce1
-0.053
si:ch211-218m3.13
0.199
rbbp4
-0.052
si:ch211-59d8.3
0.198
si:ch211-51e12.7
-0.052
LOC110437835
0.195
msna
-0.051
ago3a
0.193
tars
-0.050
lect2l
0.193
top1l
-0.050