Daniocell
usf2 (taste / olfactory)
"upstream transcription factor 2, c-fos interacting"
ZFIN
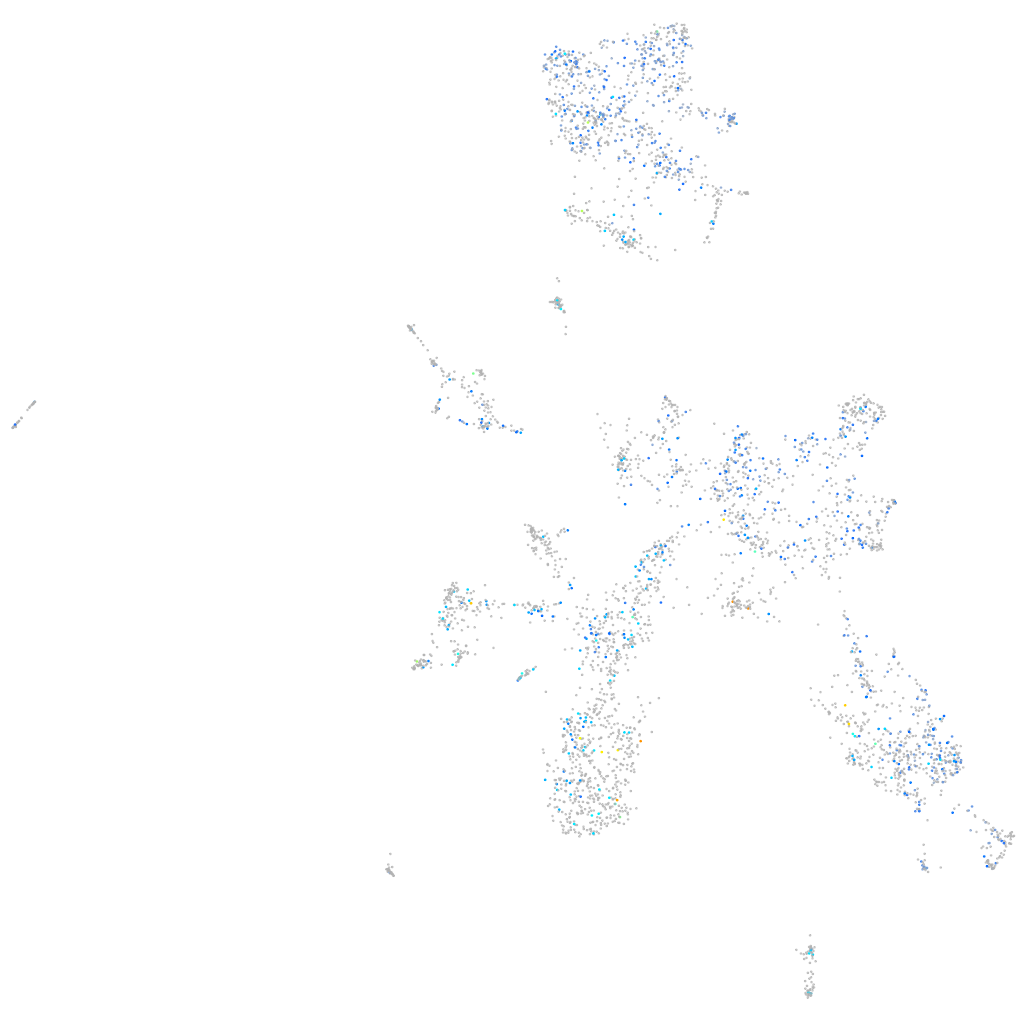
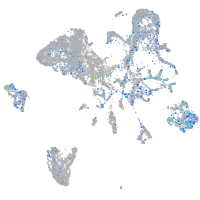
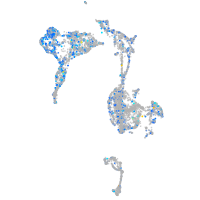
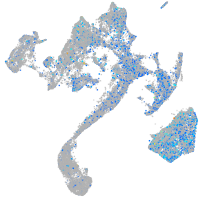
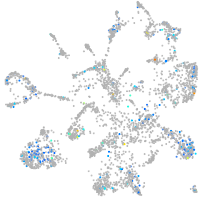
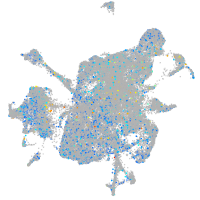
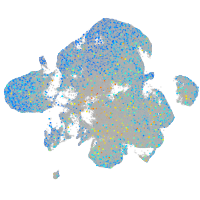
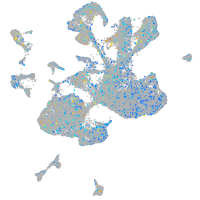
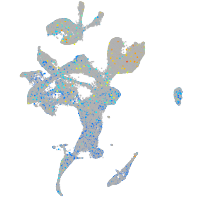
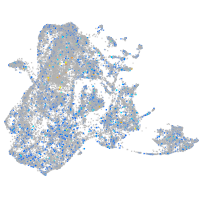
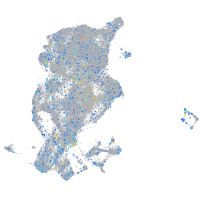
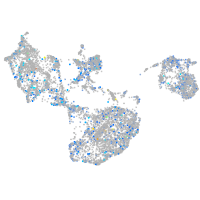
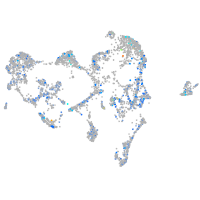
Gene expression UMAP
Display:
Expression
Stage
Other cell groups
all cells
blastomeres
PGCs
endoderm
axial mesoderm
muscle
mural cells /
non-skeletal muscle
mesenchyme
hematopoietic /
vasculature
pronephros
neural
spinal cord / glia
eye
taste / olfactory
otic / lateral line
epidermis
periderm
fin
ionocytes / mucous
pigment cells
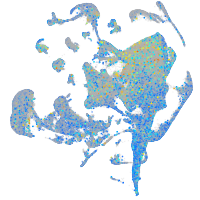
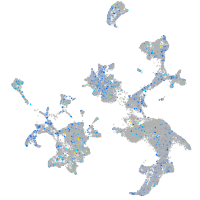
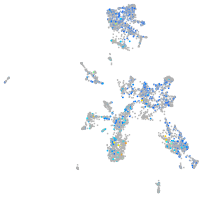
Expression by stage/cluster
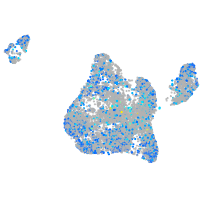
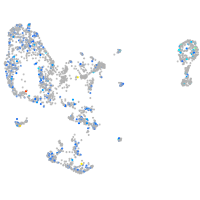
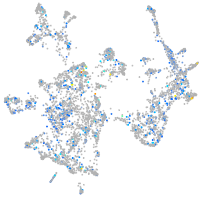
Correlated gene expression
Positive correlation
Negative correlation
Gene
r
Gene
r
XLOC-030226
0.133
hbbe1.3
-0.057
LOC101884237
0.128
pacsin1a
-0.046
AL935198.2
0.128
tmbim1b
-0.045
nt5c1bb
0.107
NC-002333.4
-0.044
LO018629.1
0.105
ttc12
-0.044
znf1103
0.100
rsph14
-0.043
LOC110437969
0.098
cacna1db
-0.041
tlx3b
0.096
ift172
-0.040
LOC101884695
0.093
ankrd45
-0.040
rxrbb
0.092
catip
-0.040
zgc:110410
0.092
actc1b
-0.040
LOC108183500
0.090
lnpk
-0.040
si:ch211-191i18.2
0.089
hbbe1.1
-0.039
XLOC-036361
0.088
prdm2a
-0.039
olfcg9
0.088
gngt2b
-0.039
psma1
0.088
XLOC-043861
-0.039
LOC103911324
0.088
ywhag1
-0.039
tmprss4a
0.087
emx1
-0.039
atn1
0.086
si:dkey-183i3.5
-0.038
LOC103908679
0.086
ypel1
-0.038
si:ch211-156p11.1
0.084
NC-002333.17
-0.038
fbxo43
0.084
rsph9
-0.038
clip2
0.084
casc1
-0.038
bdnf
0.083
crabp1a
-0.038
XLOC-042938
0.083
hectd2
-0.037
brd2a
0.083
eef2l2
-0.037
timm29
0.082
FP101882.1
-0.037
tmem182a
0.082
iqub
-0.037
pkp3b
0.082
cpe
-0.037
CABZ01084963.1
0.082
si:ch73-81k8.2
-0.037
CR391991.5
0.081
BX324188.1
-0.037
angpt1
0.081
hbae1.3
-0.037
CABZ01060490.1
0.080
zgc:158463
-0.037
smarcb1a
0.080
BX511021.1
-0.036
LOC101885382
0.080
ttll6
-0.036