Daniocell
usb1 (periderm)
U6 snRNA biogenesis 1
ZFIN
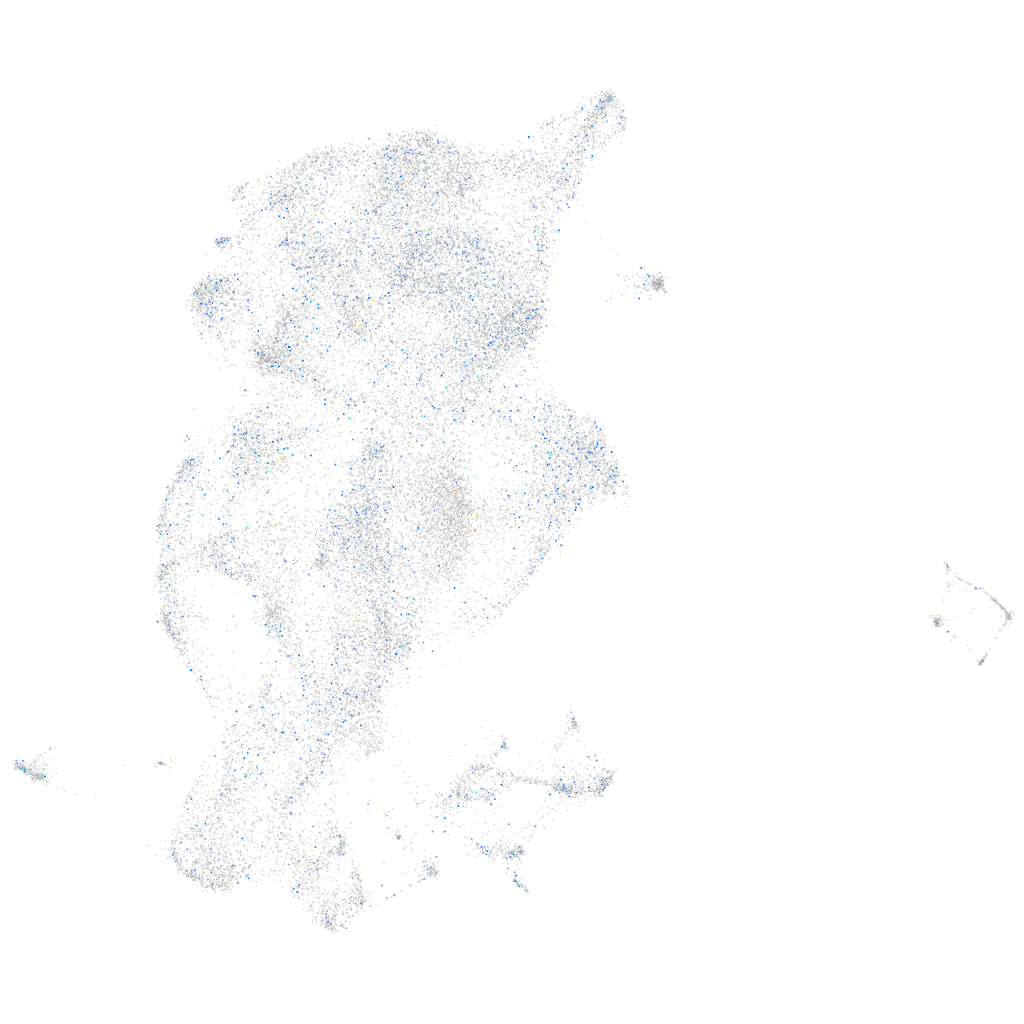
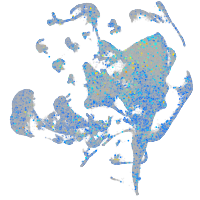
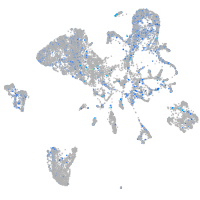
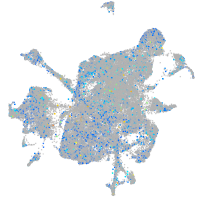
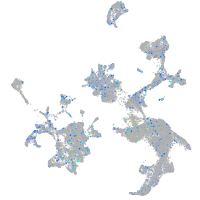
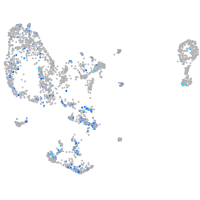
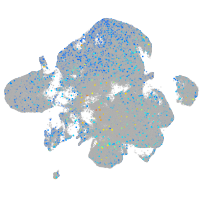
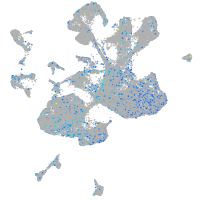
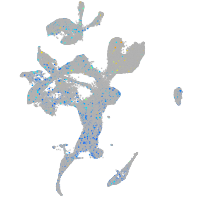
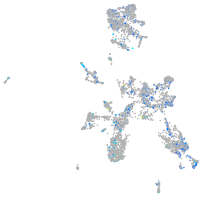
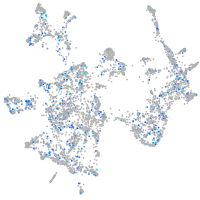
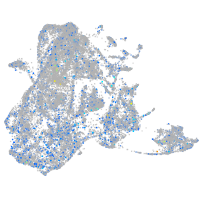
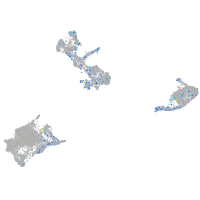
Gene expression UMAP
Display:
Expression
Stage
Other cell groups
all cells
blastomeres
PGCs
endoderm
axial mesoderm
muscle
mural cells /
non-skeletal muscle
mesenchyme
hematopoietic /
vasculature
pronephros
neural
spinal cord / glia
eye
taste / olfactory
otic / lateral line
epidermis
periderm
fin
ionocytes / mucous
pigment cells
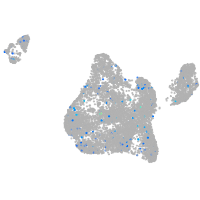
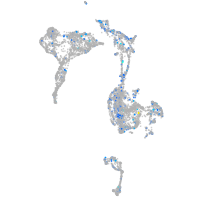
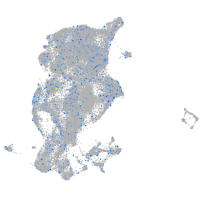
Expression by stage/cluster
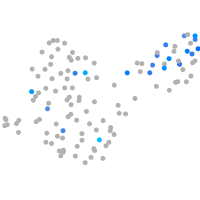
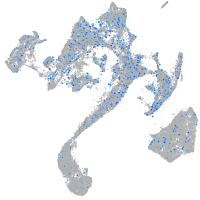
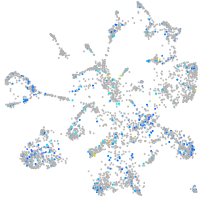
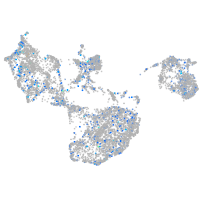
Correlated gene expression
Positive correlation
Negative correlation
Gene
r
Gene
r
LOC101886433
0.078
CABZ01072614.1
-0.037
CU928069.1
0.077
zgc:158463
-0.030
CABZ01045212.1
0.075
NC-002333.4
-0.028
LOC108181229
0.070
NC-002333.17
-0.027
cox4i1
0.059
osgn1
-0.026
si:ch73-52f15.5
0.058
LOC110439372
-0.025
atp5f1d
0.058
COX3
-0.024
eef1b2
0.057
duox2
-0.023
pycard
0.057
XLOC-041945
-0.023
or126-1
0.057
CT583728.23
-0.023
eef1g
0.056
etnk1
-0.021
si:ch73-250a16.5
0.055
ckma
-0.021
cox6b2
0.055
mt-co1
-0.021
tmem45b
0.055
alox12
-0.020
cct5
0.054
tnks1bp1
-0.020
LOC110438002
0.054
LOC110439627
-0.020
sod1
0.053
si:ch73-141c7.1
-0.019
s100v2
0.053
duox
-0.019
eif3f
0.052
evplb
-0.018
zgc:171500
0.052
si:ch211-264e16.1
-0.018
XLOC-034430
0.052
si:cabz01007794.1
-0.018
tomm7
0.052
zgc:110425
-0.017
si:dkey-112e7.2
0.052
XLOC-000490
-0.017
tlr4bb
0.051
kmt5ab
-0.017
psma5
0.051
hbae1.1
-0.017
atp5mc3b
0.051
adcy3a
-0.017
edf1
0.051
AL935186.9
-0.017
fxyd6l
0.051
tnfaip3
-0.017
rpl19
0.050
arl13a
-0.017
ran
0.050
pttg1
-0.016
glo1
0.050
mt-co2
-0.016
CT583728.24
0.050
stxbp5b
-0.016
c3a.5
0.050
rps18
-0.016
col5a2b
0.050
ube2c
-0.016
CT027772.2
0.049
vti1a
-0.016