Daniocell
unc5da (blastomeres)
unc-5 netrin receptor Da
ZFIN
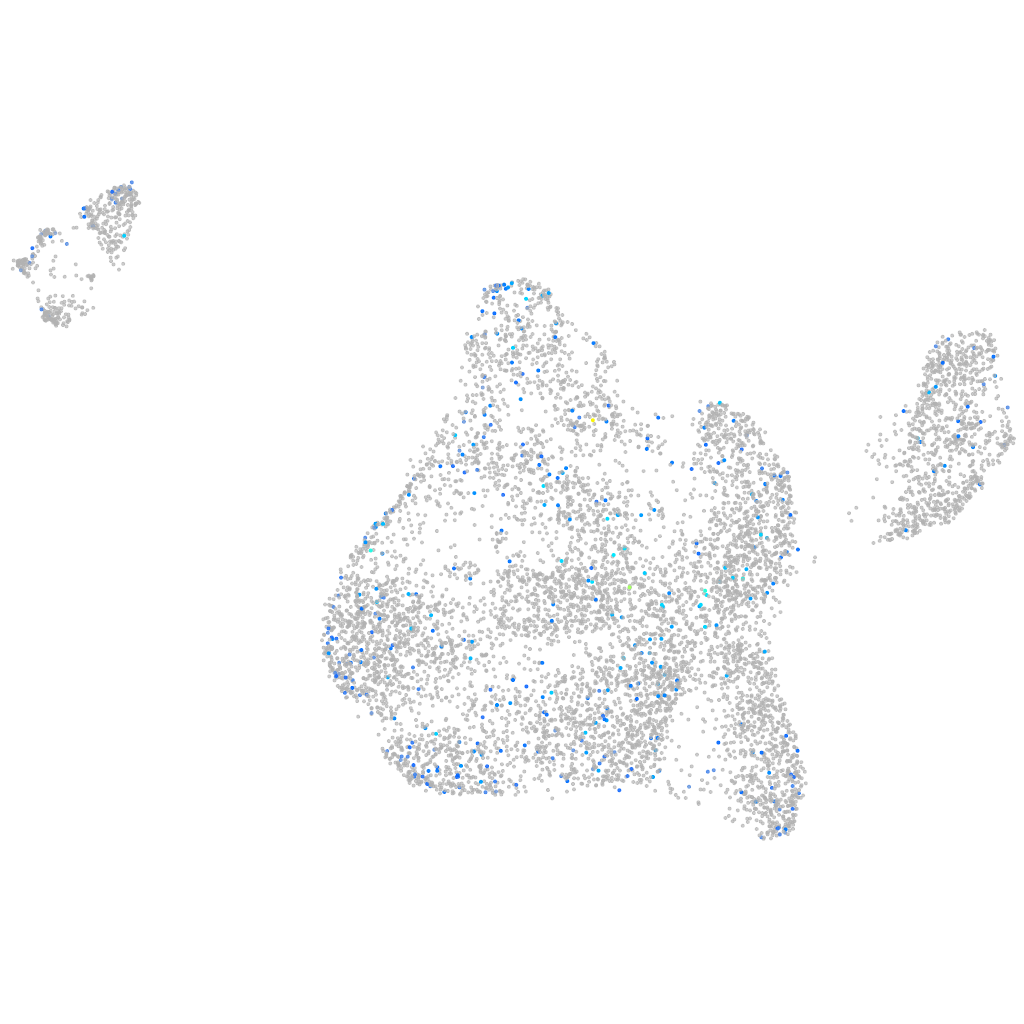
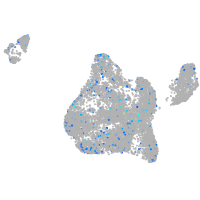
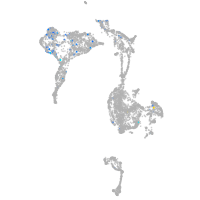
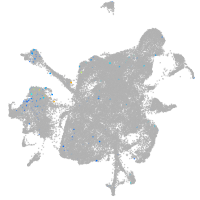
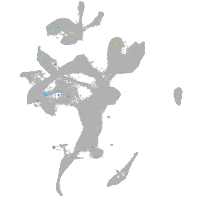
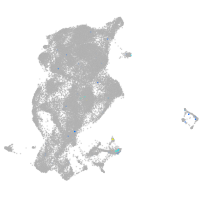
Gene expression UMAP
Display:
Expression
Stage
Other cell groups
all cells
blastomeres
PGCs
endoderm
axial mesoderm
muscle
mural cells /
non-skeletal muscle
mesenchyme
hematopoietic /
vasculature
pronephros
neural
spinal cord / glia
eye
taste / olfactory
otic / lateral line
epidermis
periderm
fin
ionocytes / mucous
pigment cells
Expression by stage/cluster
Correlated gene expression
Positive correlation
Negative correlation
Gene
r
Gene
r
g6pca.1
0.086
zmat2
-0.034
si:dkey-4j21.1
0.083
pfdn1
-0.031
BX927394.3
0.079
ilk
-0.031
LOC101884710
0.079
rpp21
-0.030
LOC101883911
0.076
nudt5
-0.029
si:dkey-18a10.3
0.069
si:dkeyp-75h12.5
-0.029
styk1a
0.069
utp6
-0.029
CABZ01074130.1
0.068
gtf2f2b
-0.028
nr2e1
0.068
XLOC-029028
-0.028
mov10b.1
0.067
srp72
-0.027
slc1a3b
0.067
anxa11b
-0.027
XLOC-006989
0.066
gas8
-0.027
col11a1a
0.066
znf706
-0.027
si:ch211-271d10.2
0.065
rhoq
-0.027
cd59
0.065
slc17a9b
-0.026
BX545917.6
0.064
ss18l2
-0.026
grem1b
0.064
sh3glb2b
-0.026
CR339054.2
0.062
mid1ip1a
-0.026
CABZ01059914.1
0.061
sec61b
-0.026
kcnj2b
0.060
setd5
-0.025
si:ch1073-376c22.1
0.060
dmac2l
-0.025
pla2g12b
0.059
ap3m1
-0.025
LOC100536441
0.059
CDPF1
-0.025
CABZ01057159.1
0.059
cds2
-0.025
CR385065.1
0.059
si:dkey-195m11.8
-0.025
GLB1L2
0.058
adipor2
-0.025
dao.1
0.058
snapc3
-0.024
ren
0.058
BX649300.1
-0.024
pimr179
0.058
BX005396.2
-0.024
cd248b
0.058
bmt2
-0.024
LOC103909828
0.058
cited4b
-0.024
XLOC-002952
0.057
ucp2
-0.024
XLOC-010593
0.057
si:ch211-51h4.2
-0.024
LOC101886083
0.057
porcnl
-0.024
si:dkeyp-67e1.6
0.057
h3f3d
-0.023