Daniocell
ulk1a (hematopoietic / vasculature)
unc-51 like autophagy activating kinase 1a
ZFIN
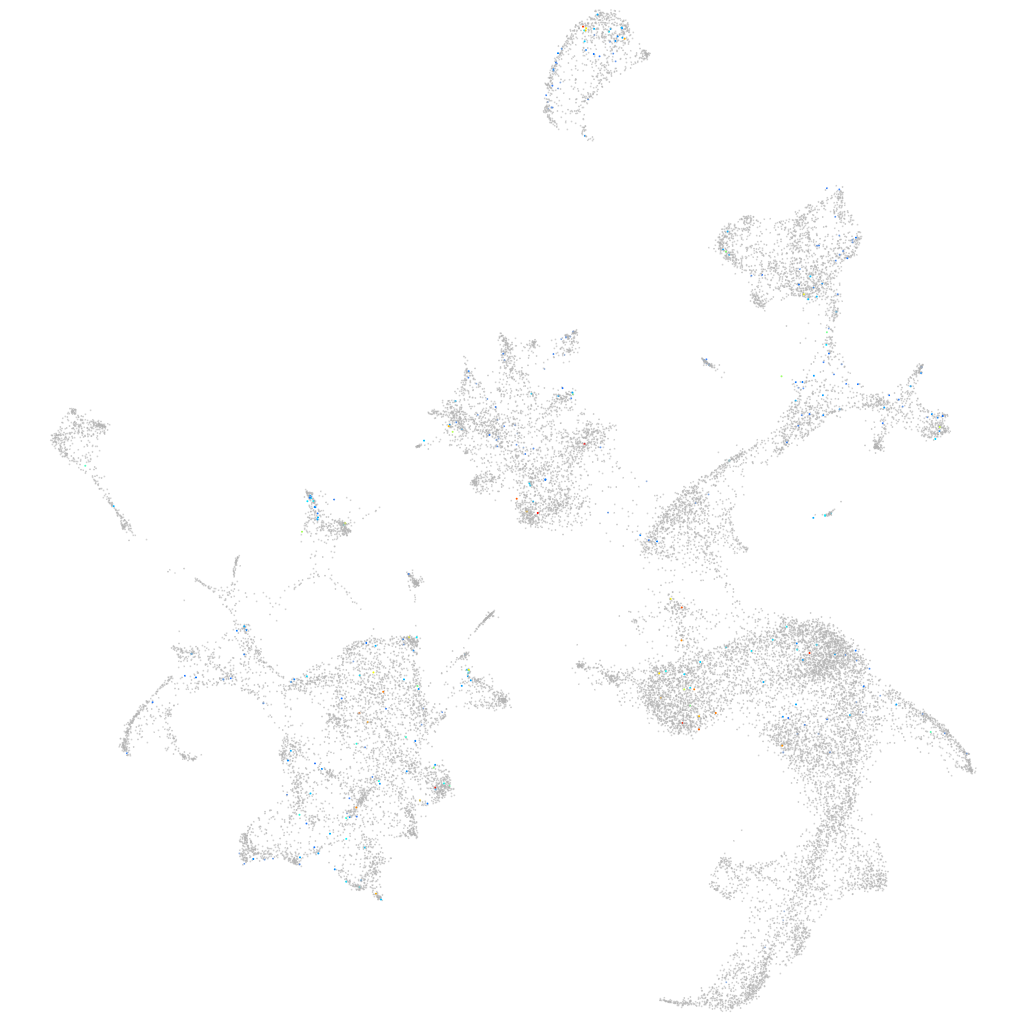
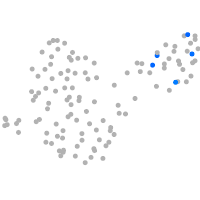
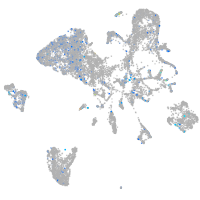
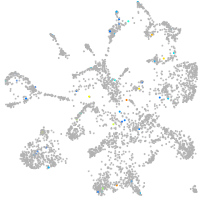
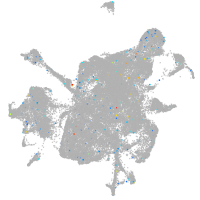
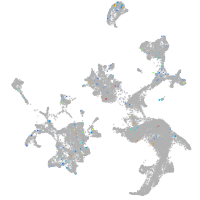
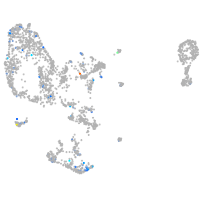
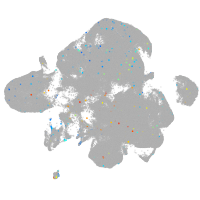
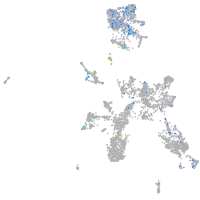
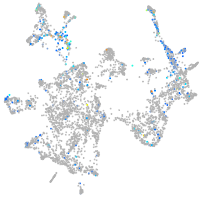
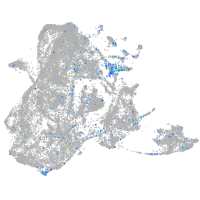
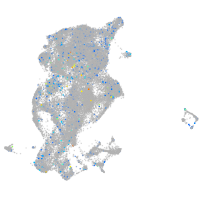
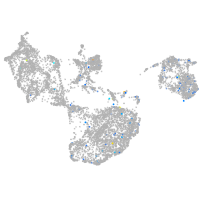
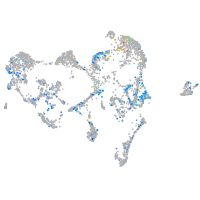
Gene expression UMAP
Display:
Expression
Stage
Other cell groups
all cells
blastomeres
PGCs
endoderm
axial mesoderm
muscle
mural cells /
non-skeletal muscle
mesenchyme
hematopoietic /
vasculature
pronephros
neural
spinal cord / glia
eye
taste / olfactory
otic / lateral line
epidermis
periderm
fin
ionocytes / mucous
pigment cells
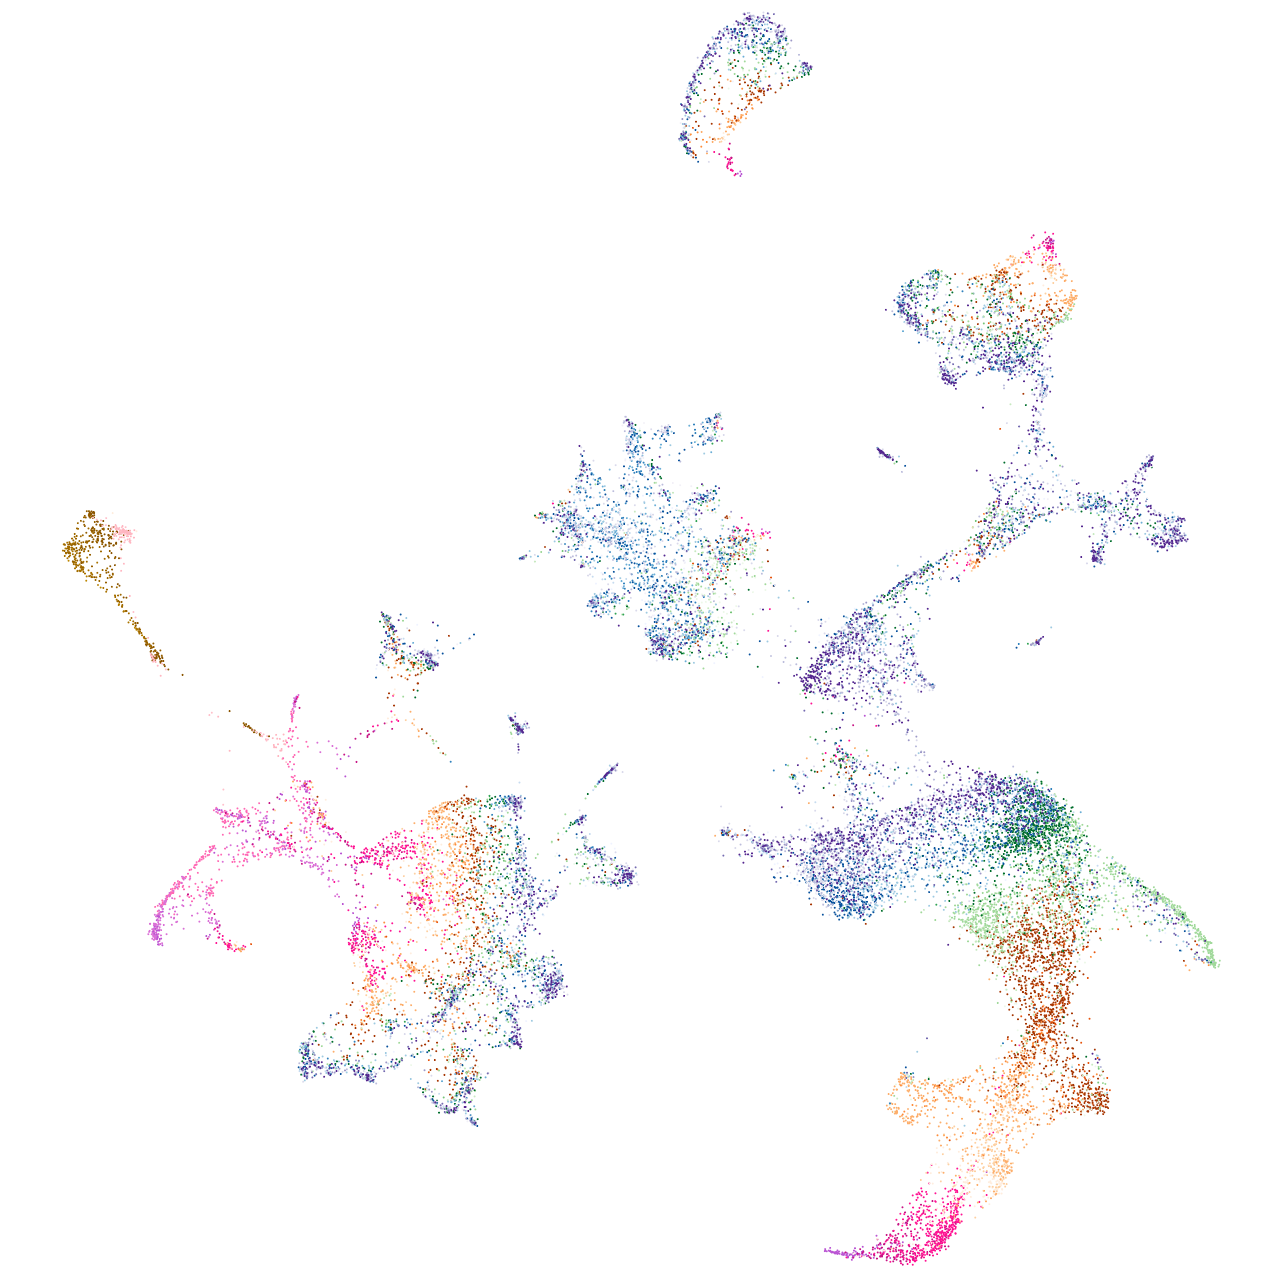
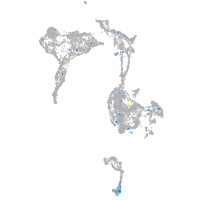
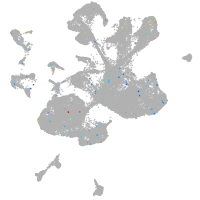
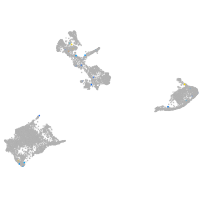
Expression by stage/cluster
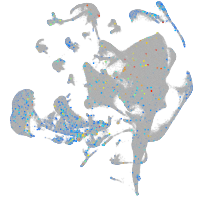
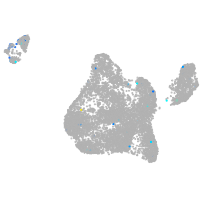
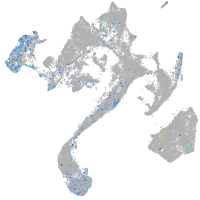
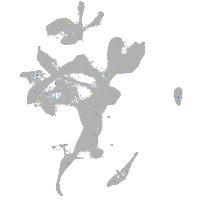
Correlated gene expression
Positive correlation
Negative correlation
Gene
r
Gene
r
phf1
0.146
hbae1.1
-0.046
LOC110439851
0.121
hbbe3
-0.046
TMEM236
0.118
tmem14ca
-0.042
or101-1
0.118
slc4a1a
-0.042
tradv8.0
0.112
hbae1.3
-0.042
LO018597.2
0.105
zgc:163057
-0.042
si:dkey-217g21.3
0.101
hbbe1.3
-0.041
BX005056.1
0.101
cahz
-0.041
kcnj16
0.097
hbae3
-0.040
si:ch73-329n5.1
0.097
prdx2
-0.040
edar
0.092
klf1
-0.040
mhc2dbb
0.092
blvrb
-0.038
si:ch211-220f12.4
0.092
znfl2a
-0.037
LOC110439382
0.091
urod
-0.036
XLOC-033512
0.088
hbbe1.2
-0.036
c3a.4
0.085
uros
-0.035
si:dkey-11e23.9
0.085
hmbsb
-0.035
LOC110437931
0.083
rfesd
-0.035
CR354402.1
0.079
hemgn
-0.035
si:dkey-203a12.4
0.078
alad
-0.035
gckr
0.078
hbbe2
-0.035
taar14h
0.078
hmbsa
-0.035
LOC108191530
0.078
hbbe1.1
-0.034
thegl
0.078
nmt1b
-0.034
clca1
0.077
si:ch211-227m13.1
-0.034
doc2a
0.076
tmod4
-0.034
spink2.5
0.076
gata1a
-0.034
tgm8
0.075
epb41b
-0.034
si:ch211-194m7.5
0.074
alas2
-0.033
si:ch1073-188e1.1
0.073
dmtn
-0.032
RF00342
0.072
tfr1a
-0.032
AL807792.1
0.072
glrx5
-0.031
slc38a8a
0.072
hdr
-0.031
XLOC-012620
0.071
slc11a2
-0.031
FO904970.1
0.071
zgc:56095
-0.031