Daniocell
twsg1b (mural cells / non-skeletal muscle)
twisted gastrulation BMP signaling modulator 1b
ZFIN
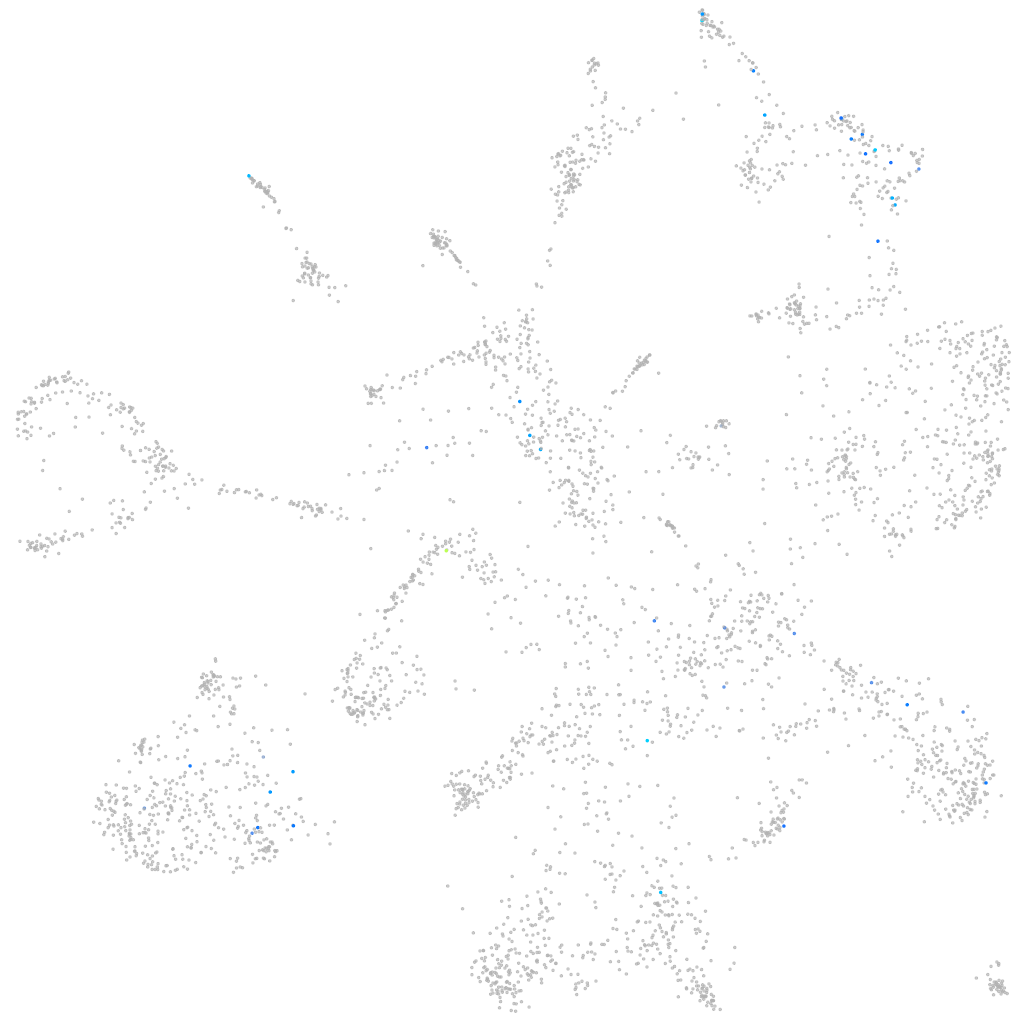
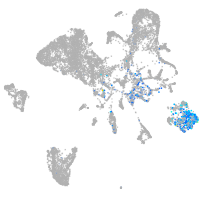
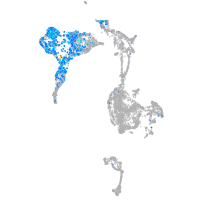
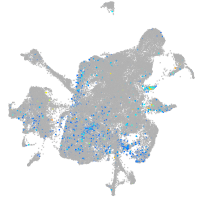
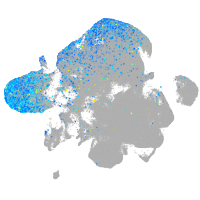
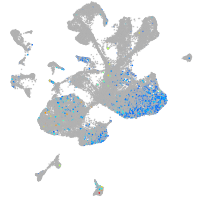
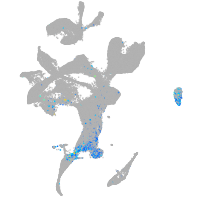
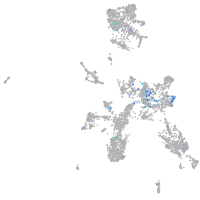
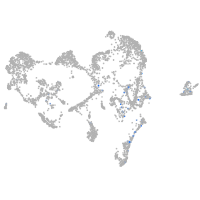
Gene expression UMAP
Display:
Expression
Stage
Other cell groups
all cells
blastomeres
PGCs
endoderm
axial mesoderm
muscle
mural cells /
non-skeletal muscle
mesenchyme
hematopoietic /
vasculature
pronephros
neural
spinal cord / glia
eye
taste / olfactory
otic / lateral line
epidermis
periderm
fin
ionocytes / mucous
pigment cells
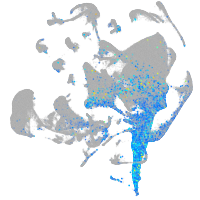
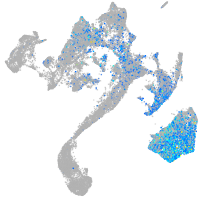
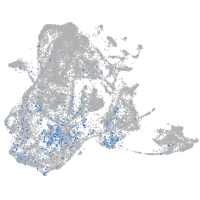
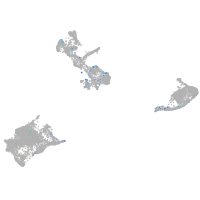
Expression by stage/cluster
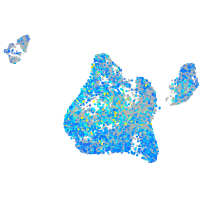
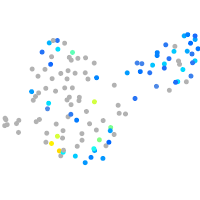
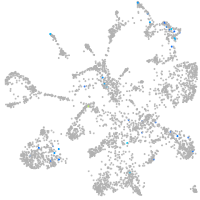
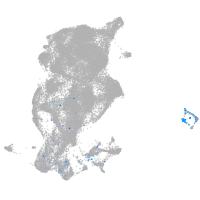
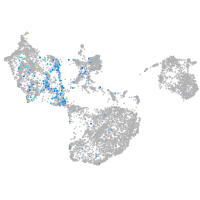
Correlated gene expression
Positive correlation
Negative correlation
Gene
r
Gene
r
hyal6
0.246
XLOC-041870
-0.060
si:dkey-199f5.3
0.210
tpm1
-0.057
LOC108182890
0.206
myl9a
-0.047
cdh16
0.197
mt-atp6
-0.043
XLOC-024629
0.195
acta2
-0.043
CABZ01066320.2
0.188
BX005183.3
-0.042
LOC103910844
0.188
rbpms2a
-0.042
avd
0.177
col1a1b
-0.041
LOC110439515
0.177
col5a2a
-0.041
LOC108191465
0.177
lmod1b
-0.041
inpp5ja
0.176
cxcl14
-0.041
si:dkey-76d14.2
0.175
myh11a
-0.041
LOC103911447
0.174
XLOC-025423
-0.040
cx27.5
0.163
col6a2
-0.039
XLOC-032793
0.163
cfd
-0.039
BX649620.1
0.163
pxna
-0.039
XLOC-002411
0.162
ak1
-0.039
BX088649.1
0.161
foxf1
-0.038
LOC110439551
0.161
aoc2
-0.038
si:ch211-79h18.2
0.159
apoa1b
-0.038
grin2aa
0.156
si:ch211-62a1.3
-0.037
BX927275.2
0.150
ifitm1
-0.036
thegl
0.145
col6a1
-0.036
XLOC-043489
0.144
foxf2a
-0.036
si:ch73-174h16.5
0.144
pabpc1b
-0.036
BX649481.1
0.142
itga1
-0.036
LOC101886638
0.140
myl6
-0.036
zgc:165604
0.139
gucy1a1
-0.036
il12ba
0.139
iscub
-0.035
zmp:0000001268
0.139
tagln
-0.035
BX284666.3
0.137
tpm2
-0.035
FP009765.1
0.137
fn1b
-0.035
CT025742.1
0.135
hbbe2
-0.035
si:dkeyp-80c12.8
0.134
apoa2
-0.034
LOC103911060
0.132
cdc42ep3
-0.034