Daniocell
twf1b (pigment cells)
twinfilin actin-binding protein 1b
ZFIN
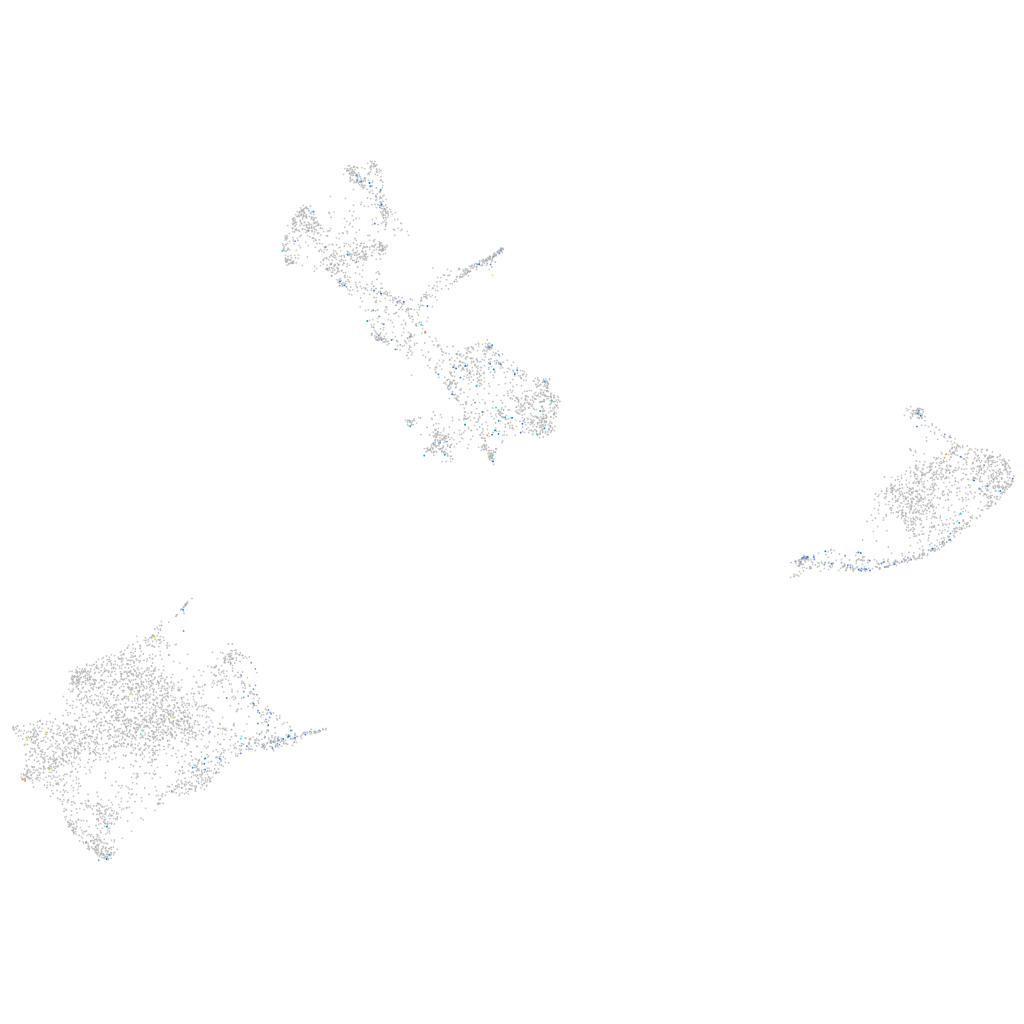
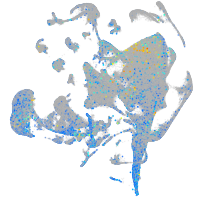
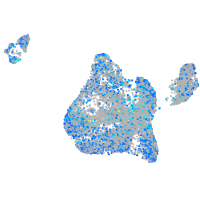
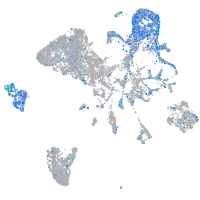
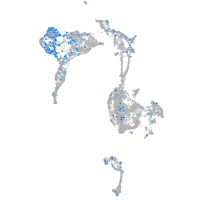
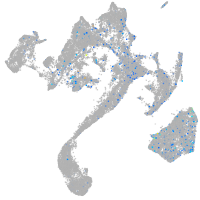
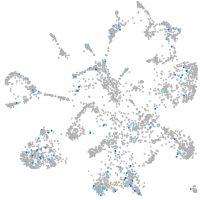
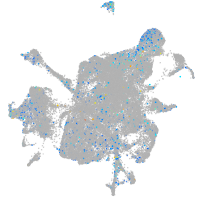
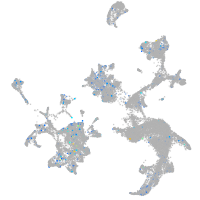
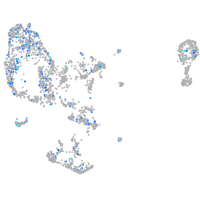
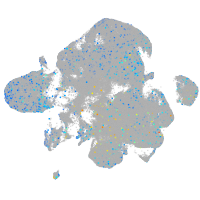
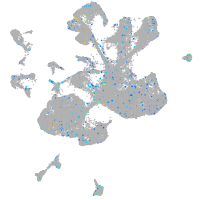
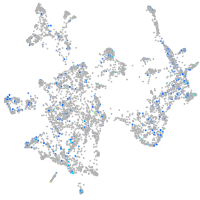
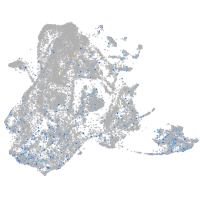
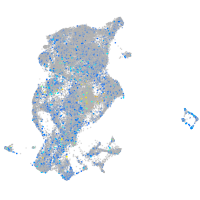
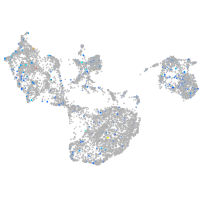
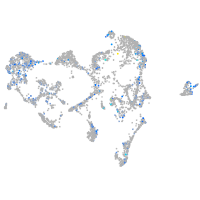
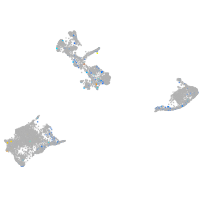
Gene expression UMAP
Display:
Expression
Stage
Other cell groups
all cells
blastomeres
PGCs
endoderm
axial mesoderm
muscle
mural cells /
non-skeletal muscle
mesenchyme
hematopoietic /
vasculature
pronephros
neural
spinal cord / glia
eye
taste / olfactory
otic / lateral line
epidermis
periderm
fin
ionocytes / mucous
pigment cells
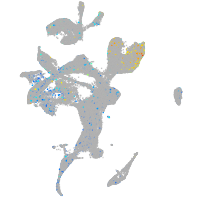
Expression by stage/cluster
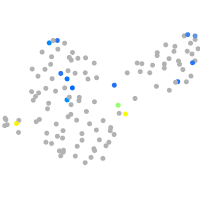
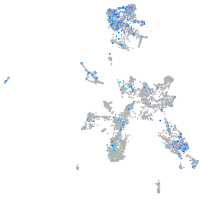
Correlated gene expression
Positive correlation
Negative correlation
Gene
r
Gene
r
LOC110440213
0.202
gstp1
-0.061
BX663611.1
0.185
zgc:110339
-0.059
nr1h4
0.169
si:dkey-251i10.2
-0.049
calcr
0.159
hbae3
-0.044
LOC101885703
0.149
csrp2
-0.042
gsg1l2a
0.138
pvalb2
-0.041
XLOC-035229
0.136
slc22a7a
-0.041
XLOC-000324
0.132
si:ch211-251b21.1
-0.038
LOC100329560
0.126
pvalb1
-0.036
tekt2
0.125
phyhd1
-0.036
cacna1fb
0.124
uraha
-0.036
cbln8
0.119
hbae1.1
-0.036
avil
0.119
rtn1b
-0.035
LOC100329307
0.118
zgc:153031
-0.034
pym1
0.117
s100a10b
-0.034
mcf2a
0.115
hbbe1.3
-0.033
lrtm2b
0.114
gch2
-0.033
tmem173
0.114
tmsb4x
-0.032
BX323016.1
0.112
CABZ01021592.1
-0.031
si:ch1073-391i24.1
0.112
rhag
-0.031
CU207354.1
0.111
aqp3a
-0.030
LOC103909006
0.111
mdh1aa
-0.030
adrb3b
0.109
TMEM19
-0.030
grin2ca
0.107
alas1
-0.030
mtmr7b
0.107
fbp1a
-0.029
atp2a2a
0.105
aldh9a1a.1
-0.029
zgc:136870
0.105
krt18b
-0.029
ptf1a
0.104
rplp2
-0.029
myoz2b
0.104
si:dkey-73n8.3
-0.028
gprc6a
0.104
gsto2
-0.027
ANPEP
0.101
bco1
-0.027
spag6
0.101
sult1st1
-0.027
LOC101883052.1
0.101
glrx
-0.026
RNF14 (1 of many)
0.100
pts
-0.026
crb1
0.099
LOC101886030
-0.026