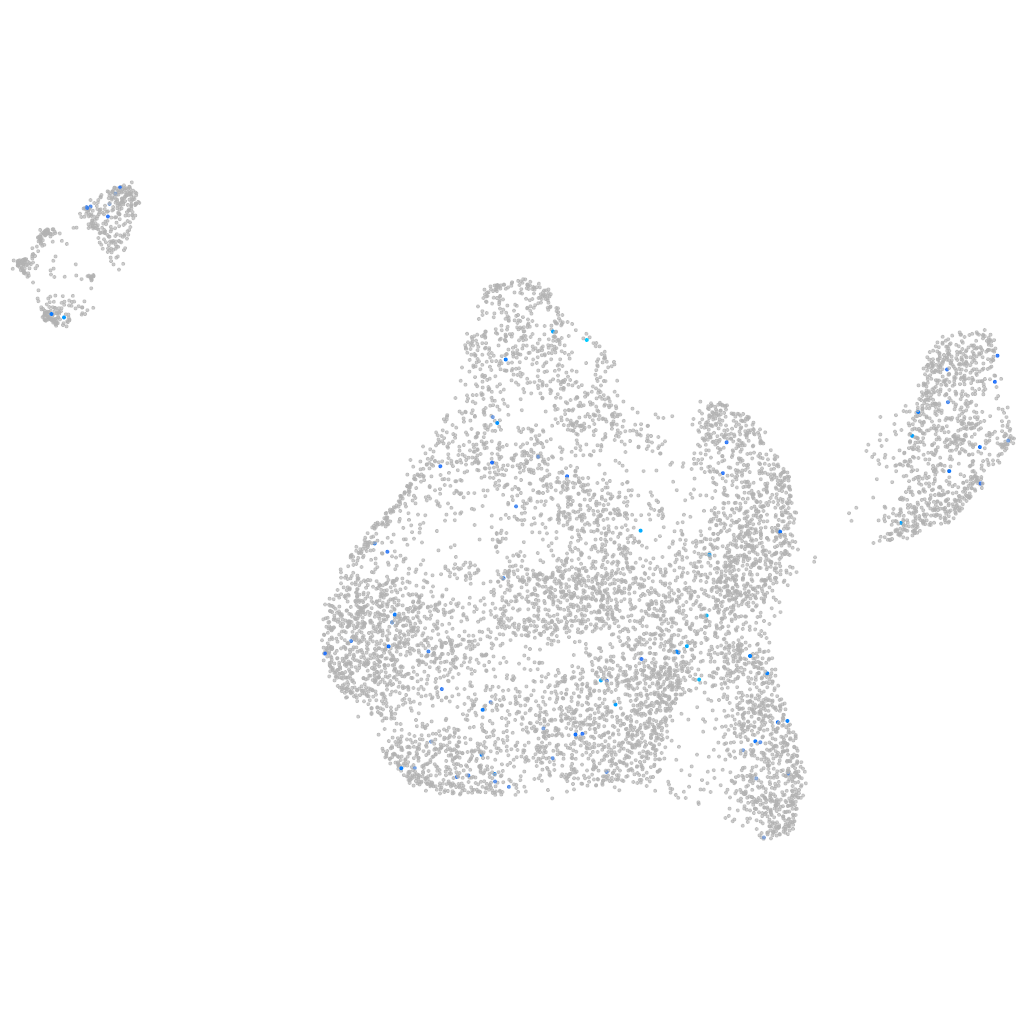
Daniocell
tulp1a (blastomeres)
TUB like protein 1a
ZFIN
Gene expression UMAP
Display:
Expression
Stage
Other cell groups
all cells
blastomeres
PGCs
endoderm
axial mesoderm
muscle
mural cells /
non-skeletal muscle
mesenchyme
hematopoietic /
vasculature
pronephros
neural
spinal cord / glia
eye
taste / olfactory
otic / lateral line
epidermis
periderm
fin
ionocytes / mucous
pigment cells
Expression by stage/cluster
Correlated gene expression
Positive correlation
Negative correlation
Gene
r
Gene
r
TULP1
0.209
nusap1
-0.037
FP067442.1
0.162
apoc1
-0.034
gpr37b
0.152
mt-co2
-0.031
CU633479.5
0.148
zar1
-0.029
cart2
0.135
tma7
-0.028
si:ch211-241b2.5
0.131
fkbp7
-0.028
si:dkey-11o15.7
0.130
abhd17aa
-0.028
si:dkey-192g7.3
0.129
anp32e
-0.027
si:dkey-96f10.1
0.127
si:ch211-222l21.1
-0.027
LOC108183843
0.123
magoh
-0.027
si:dkey-38n4.2
0.119
stox1
-0.027
muc5f
0.117
ctsla
-0.026
LOC100537963
0.116
eftud2
-0.026
vsig10l2
0.113
fzd7a
-0.026
aldh1a3
0.109
ppp1r14bb
-0.026
LOC103911920
0.109
mrps28
-0.026
LOC101882313
0.109
psmc6
-0.026
AL954327.1
0.109
ved
-0.026
emilin2b
0.107
si:ch211-262h13.3
-0.025
CR848833.1
0.105
mid1ip1b
-0.025
BX530064.1
0.104
gpat4
-0.025
syt14b
0.104
slc25a33
-0.025
ovgp1
0.099
mt-nd2
-0.024
RF01296
0.098
zgc:173709
-0.024
si:dkey-205h23.2
0.098
suclg2
-0.024
slitrk4
0.097
rplp0
-0.024
tnk2a
0.096
mt-co1
-0.024
hbae3
0.095
hdac1
-0.024
LOC101884915
0.095
XLOC-031070
-0.024
xrra1
0.094
sept12
-0.024
CU179643.1
0.090
lsm6
-0.023
ftr92
0.090
rpl19
-0.023
LOC101886256
0.088
rpl21
-0.023
LOC101886133
0.088
dnajc7
-0.023
penka
0.087
csnk2b
-0.023