Daniocell
ttpal (mural cells / non-skeletal muscle)
tocopherol (alpha) transfer protein-like
ZFIN
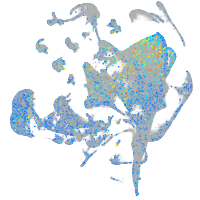
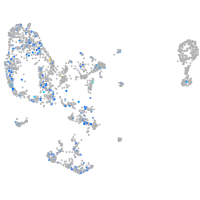
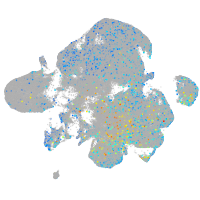
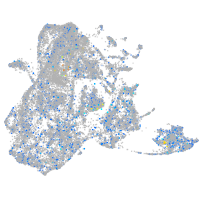
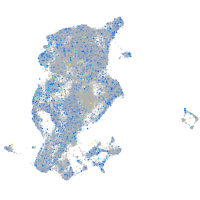
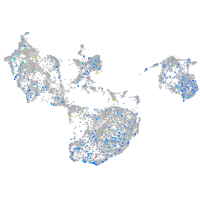
Gene expression UMAP
Display:
Expression
Stage
Other cell groups
all cells
blastomeres
PGCs
endoderm
axial mesoderm
muscle
mural cells /
non-skeletal muscle
mesenchyme
hematopoietic /
vasculature
pronephros
neural
spinal cord / glia
eye
taste / olfactory
otic / lateral line
epidermis
periderm
fin
ionocytes / mucous
pigment cells
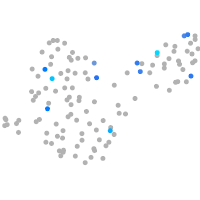
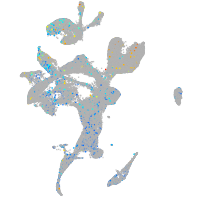
Expression by stage/cluster
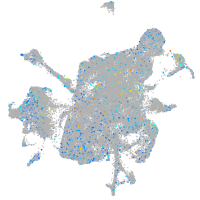
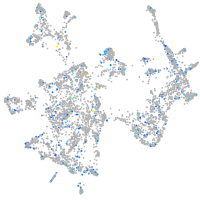
Correlated gene expression
Positive correlation
Negative correlation
Gene
r
Gene
r
si:ch211-25g7.5
0.146
rps24
-0.068
CU633479.2
0.135
rplp1
-0.067
crygm2d8
0.135
rpl21
-0.065
LOC103911284
0.134
rpl38
-0.056
grid2ipa
0.133
si:dkey-151g10.6
-0.055
LOC103911996
0.128
rpl7a
-0.054
LOC110437726
0.123
rps2
-0.053
tent5d
0.123
rps20
-0.048
LOC101884156
0.121
rps27.1
-0.048
LOC101886839
0.120
rpl26
-0.048
BX957326.2
0.115
zgc:114188
-0.048
BX005073.3
0.113
rps25
-0.048
si:dkey-23a13.2
0.113
cdca7b
-0.047
hace1
0.110
hbbe1.1
-0.046
si:ch211-158d24.2
0.110
rpl23
-0.045
tgm1l3
0.110
rps11
-0.045
cacng1b
0.108
rps27a
-0.044
RF00408
0.107
hbbe1.2
-0.044
si:dkey-18p12.4
0.107
rpl36a
-0.044
LOC103910729
0.105
rack1
-0.044
adgre9
0.104
rps10
-0.043
mhc1uma
0.104
rca2.1
-0.042
BX663611.1
0.103
rpl27a
-0.040
LOC100334495
0.102
rpl14
-0.040
cacng7a
0.101
ost4
-0.040
CABZ01071326.1
0.101
hbae1.3
-0.036
hbae5
0.100
rpl28
-0.036
slc12a8
0.099
rps28
-0.036
noxo1b
0.099
ophn1
-0.036
BX546503.1
0.099
mphosph6
-0.035
sema3ga
0.098
surf2
-0.035
asb14a
0.098
rpl30
-0.035
echdc1
0.098
rpl39
-0.035
mettl8
0.097
mvp
-0.035
XLOC-013628
0.096
tnrc6c2
-0.035