Daniocell
tsg101b (pigment cells)
tumor susceptibility 101b
ZFIN
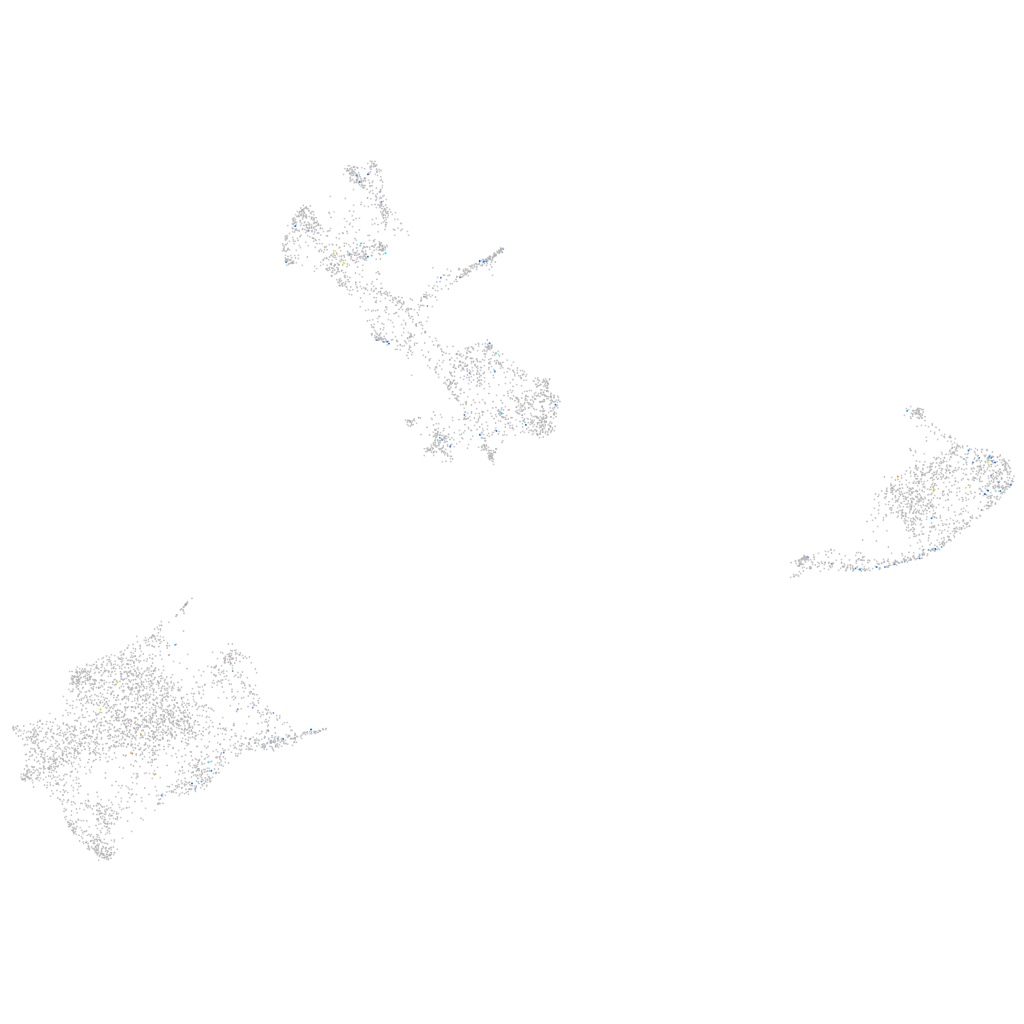
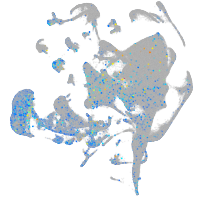
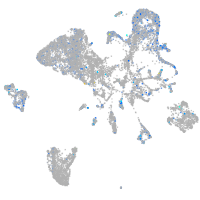
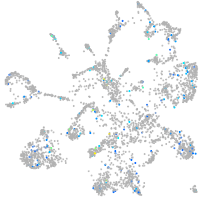
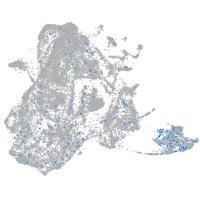
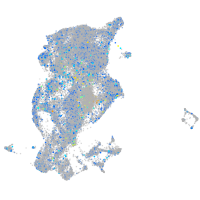
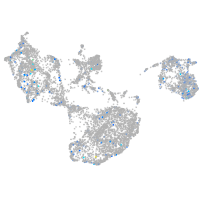
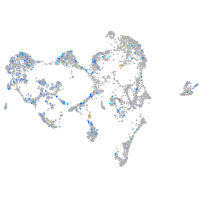
Gene expression UMAP
Display:
Expression
Stage
Other cell groups
all cells
blastomeres
PGCs
endoderm
axial mesoderm
muscle
mural cells /
non-skeletal muscle
mesenchyme
hematopoietic /
vasculature
pronephros
neural
spinal cord / glia
eye
taste / olfactory
otic / lateral line
epidermis
periderm
fin
ionocytes / mucous
pigment cells
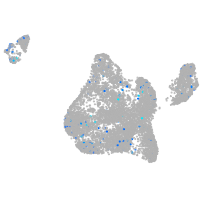
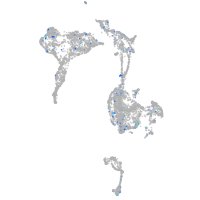
Expression by stage/cluster
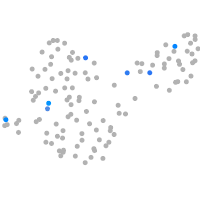
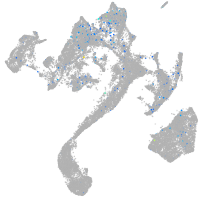
Correlated gene expression
Positive correlation
Negative correlation
Gene
r
Gene
r
si:ch211-238e22.5
0.230
si:dkey-251i10.2
-0.048
si:dkeyp-82b4.2
0.217
CABZ01021592.1
-0.041
XLOC-034235
0.201
uraha
-0.039
zgc:136858
0.188
gch2
-0.038
ccm2l
0.163
pvalb1
-0.037
il1rapl1a
0.161
krt4
-0.033
LOC100330653
0.158
prdx5
-0.032
XLOC-000666
0.157
tpma
-0.029
plvapb
0.156
bco1
-0.029
LOC101885341
0.156
zgc:110339
-0.028
CU459056.2
0.151
rpl19
-0.028
fam198b
0.150
zgc:153031
-0.028
LOC103910448
0.142
mylz3
-0.028
si:dkey-106c17.2
0.136
mdh1aa
-0.027
vipr2
0.135
rps7
-0.026
trnH
0.130
aldh1l1
-0.026
CABZ01067657.1
0.129
ttn.1
-0.026
stxbp5b
0.129
slc22a7a
-0.025
znf1034
0.128
gyg1b
-0.025
LOC100004978
0.128
apoa1b
-0.025
si:dkeyp-114g9.1
0.125
atp1b3a
-0.025
myadml2
0.125
aox5
-0.025
mc5rb
0.123
icn2
-0.024
si:dkeyp-85d8.5
0.121
pcna
-0.024
BX537168.1
0.117
gpd1b
-0.024
RF00334
0.117
myl1
-0.024
LOC101884552
0.115
pvalb2
-0.024
CR936408.1
0.115
hbae3
-0.023
XLOC-043245
0.109
cyb561a3b
-0.023
thbs3a
0.108
paics
-0.023
gpr39
0.106
hbbe1.1
-0.022
rhcgb
0.106
tmem130
-0.022
si:ch73-329n5.1
0.106
krt5
-0.022
elmo2
0.106
oacyl
-0.021
plekhn1
0.104
mylpfa
-0.021