Daniocell
trpm4a (hematopoietic / vasculature)
"transient receptor potential cation channel, subfamily M, member 4a"
ZFIN
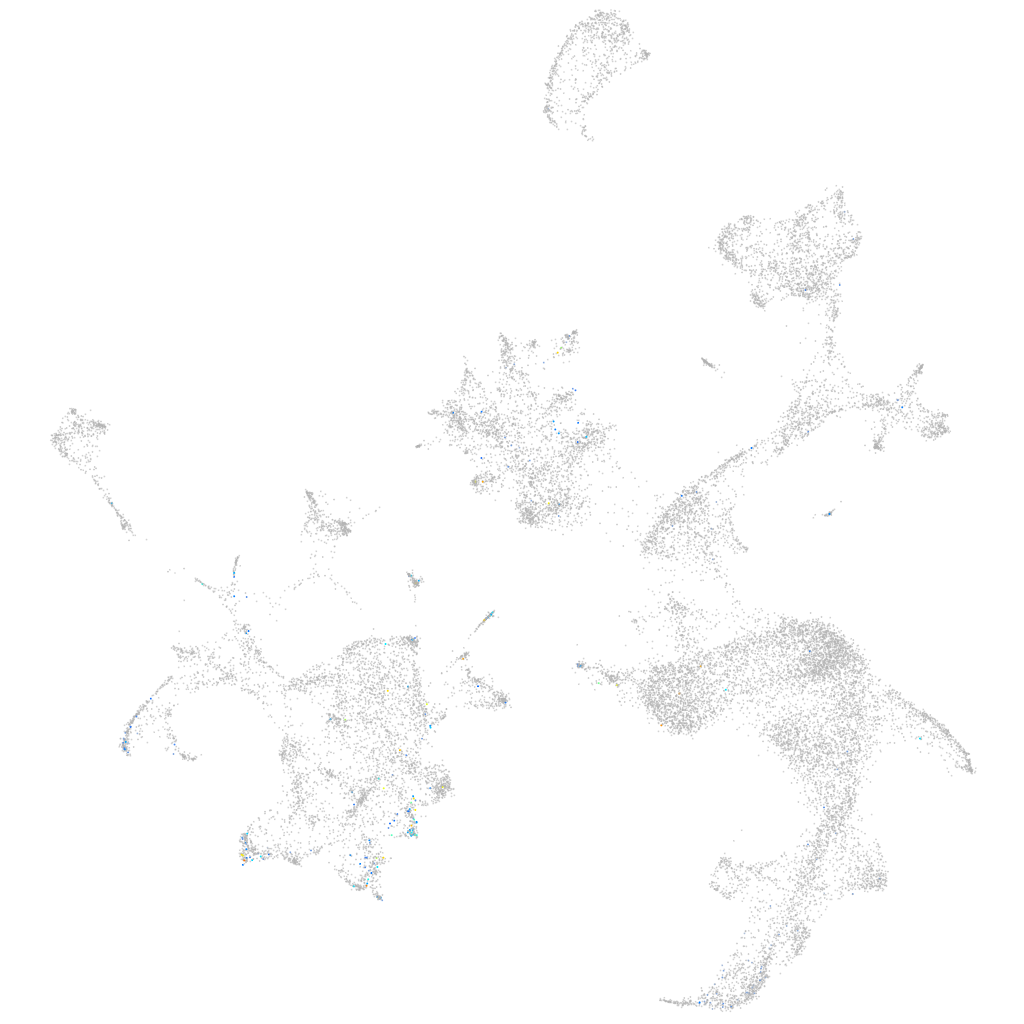
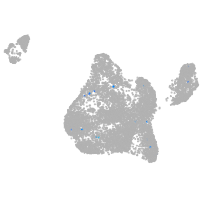
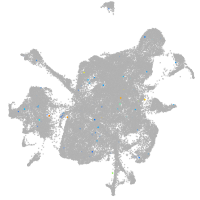
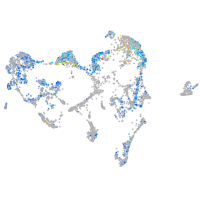
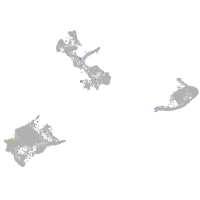
Gene expression UMAP
Display:
Expression
Stage
Other cell groups
all cells
blastomeres
PGCs
endoderm
axial mesoderm
muscle
mural cells /
non-skeletal muscle
mesenchyme
hematopoietic /
vasculature
pronephros
neural
spinal cord / glia
eye
taste / olfactory
otic / lateral line
epidermis
periderm
fin
ionocytes / mucous
pigment cells
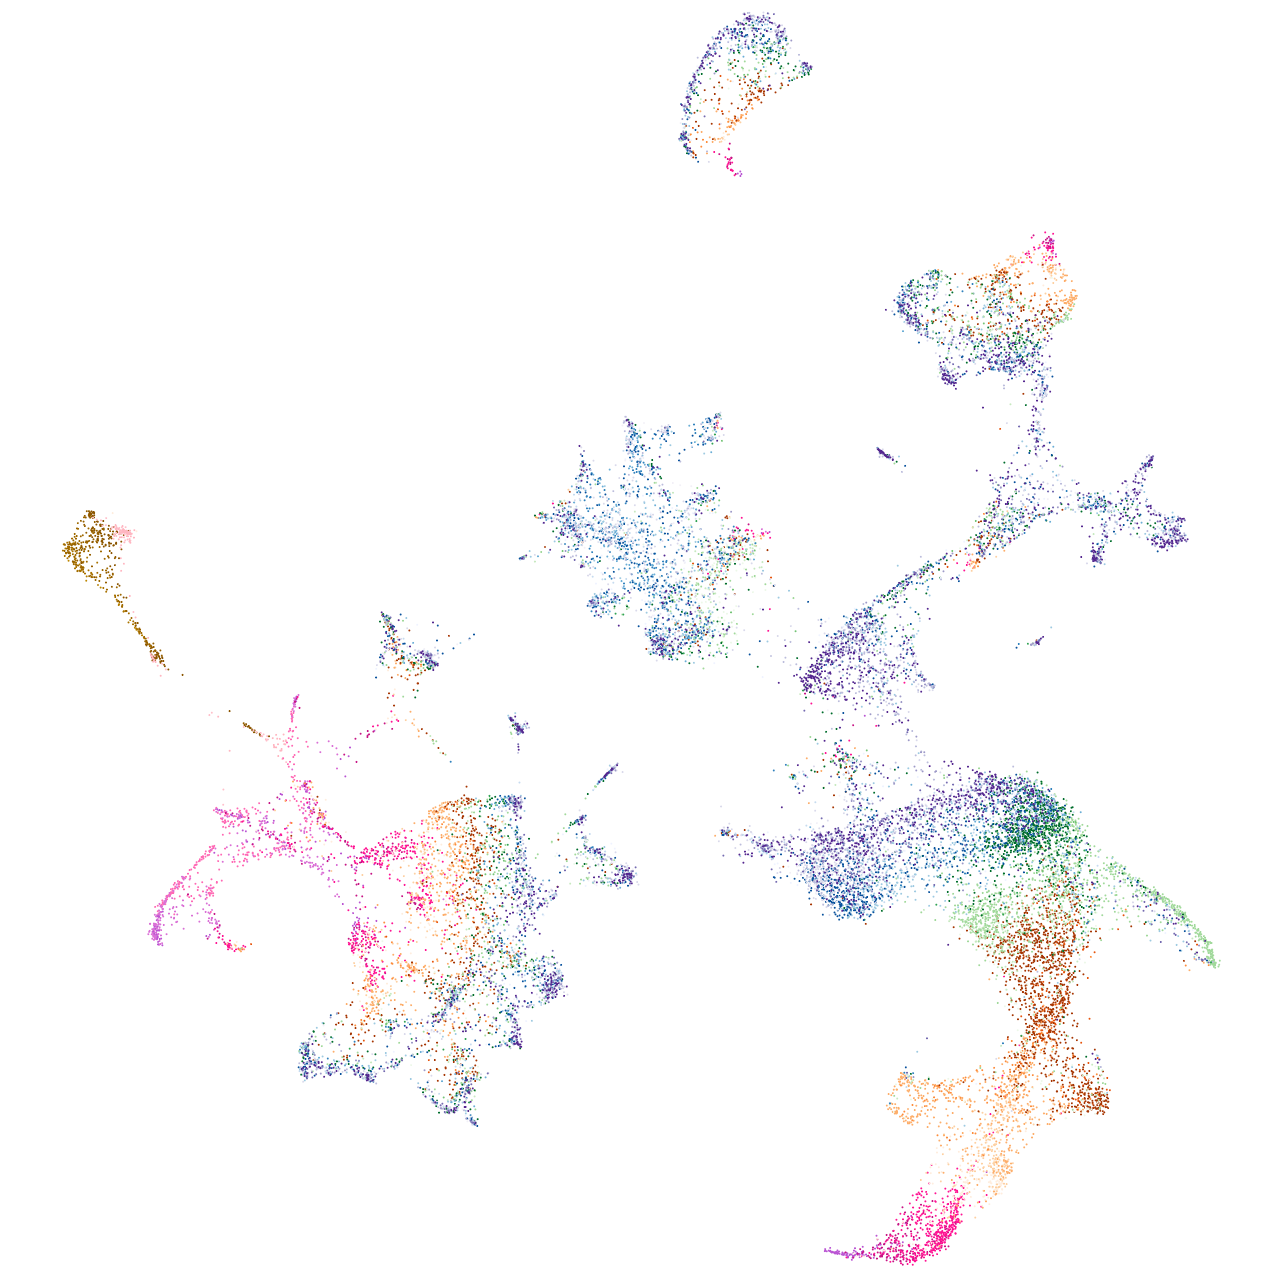
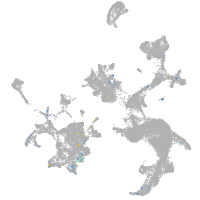
Expression by stage/cluster
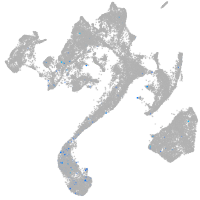
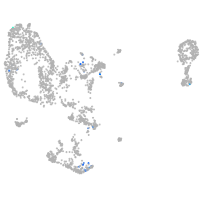
Correlated gene expression
Positive correlation
Negative correlation
Gene
r
Gene
r
XLOC-034223
0.129
tspo
-0.043
si:dkey-259j3.5
0.128
hemgn
-0.043
zgc:112332
0.126
prdx2
-0.042
cryaa
0.116
hbae1.1
-0.042
XLOC-012822
0.116
hbae1.3
-0.042
si:dkey-33c12.12
0.110
hbbe1.3
-0.041
si:dkey-42i9.16
0.109
hbbe2
-0.041
LOC108179225
0.108
fth1a
-0.041
slc6a2
0.108
hbbe1.2
-0.039
alpl
0.108
hbbe1.1
-0.038
LOC110439834
0.104
hbae3
-0.038
XLOC-000357
0.104
blvrb
-0.037
ncam3
0.104
cahz
-0.036
fkbp1b
0.103
gpx1a
-0.036
LO018260.1
0.102
nt5c2l1
-0.036
si:dkey-126g1.9
0.100
tmod4
-0.036
foxf2b
0.099
mibp2
-0.033
rasgrp3
0.097
alas2
-0.032
si:ch211-38m6.7
0.097
slc4a1a
-0.031
LOC108191800
0.095
plac8l1
-0.030
adarb2
0.095
si:ch211-250g4.3
-0.030
LOC110439557
0.094
zgc:56095
-0.030
LOC101884756
0.092
creg1
-0.029
ca4a
0.092
gstm.1
-0.028
ADAMTS7
0.090
gp9
-0.027
igfbp7
0.090
add2
-0.027
si:ch211-33e4.2
0.089
coro1a
-0.027
ednraa
0.088
si:ch211-207c6.2
-0.025
kdrl
0.088
nmt1b
-0.025
si:ch73-196i15.5
0.088
hif1al2
-0.024
epas1a
0.088
fcer1gl
-0.024
XLOC-016022
0.086
si:dkey-240n22.3
-0.023
zgc:158423
0.085
laptm5
-0.023
mmel1
0.085
selenoj
-0.023
jam2a
0.084
zgc:163057
-0.022