Daniocell
trim35-12 (periderm)
tripartite motif containing 35-12
ZFIN
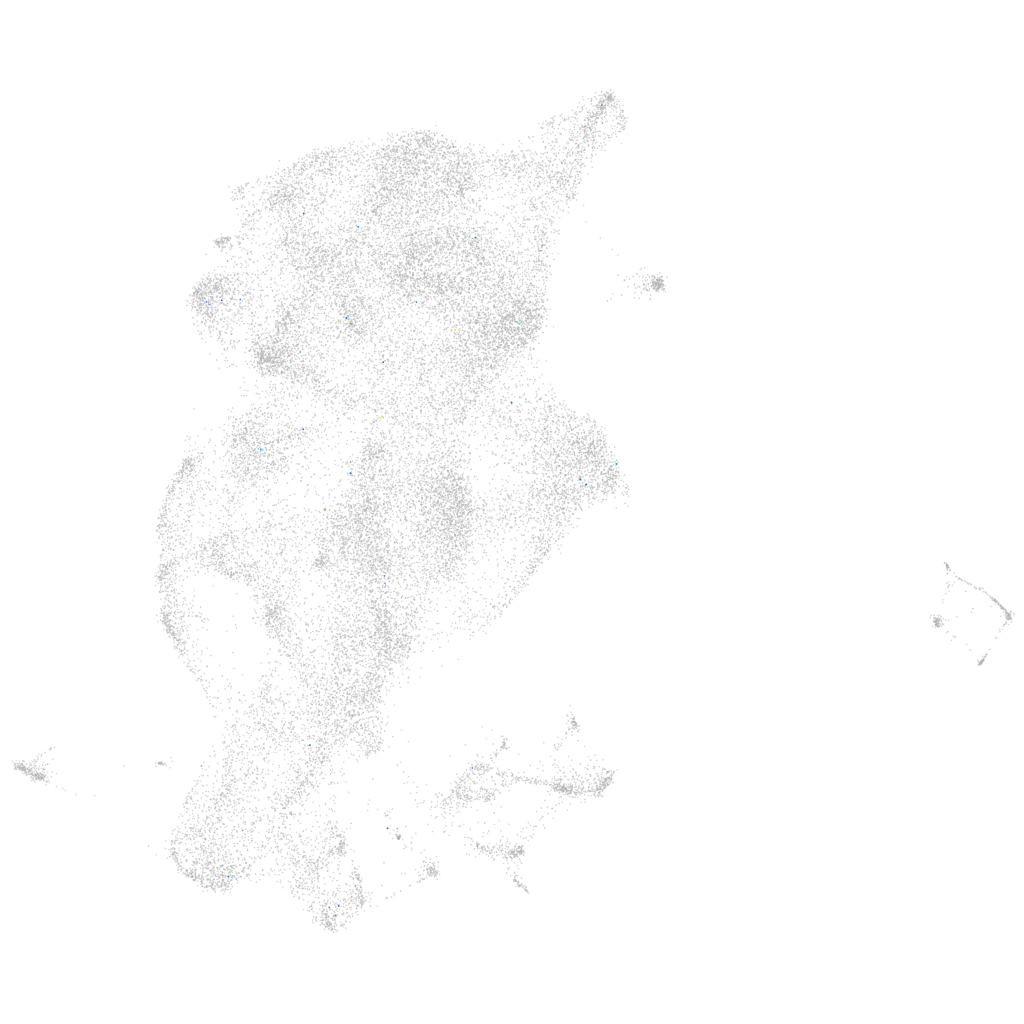
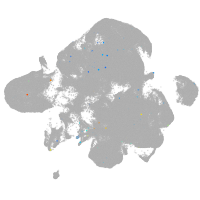
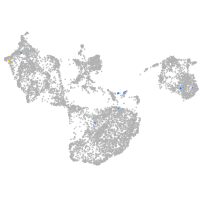
Gene expression UMAP
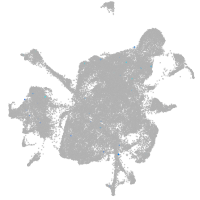
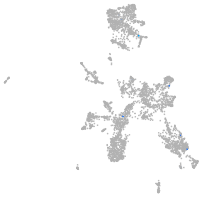
Display:
Expression
Stage
Other cell groups
all cells
blastomeres
PGCs
endoderm
axial mesoderm
muscle
mural cells /
non-skeletal muscle
mesenchyme
hematopoietic /
vasculature
pronephros
neural
spinal cord / glia
eye
taste / olfactory
otic / lateral line
epidermis
periderm
fin
ionocytes / mucous
pigment cells
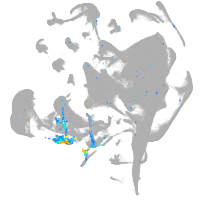
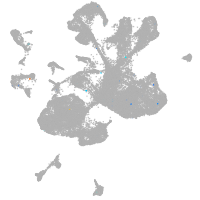
Expression by stage/cluster
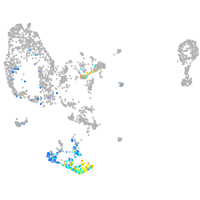
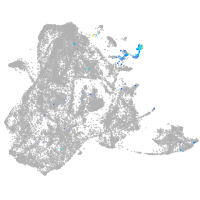
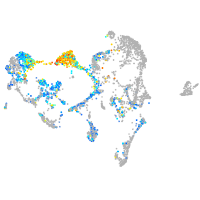
Correlated gene expression
Positive correlation
Negative correlation
Gene
r
Gene
r
plaub
0.276
anxa1c
-0.023
has3
0.273
rplp2l
-0.023
crocc2
0.267
rps24
-0.019
CR392012.2
0.253
rps12
-0.019
tekt2
0.198
rps23
-0.019
RBP1 (1 of many)
0.181
rpl8
-0.018
XLOC-021043
0.177
rpl38
-0.017
fam151a
0.175
wu:fb18f06
-0.016
si:dkey-189h5.6
0.165
rps18
-0.016
AL772362.1
0.156
btg2
-0.016
XLOC-017021
0.152
rps29
-0.016
antxr1a
0.142
zgc:114188
-0.016
reep6
0.128
cst14b.1
-0.016
cavin1a
0.124
rps2
-0.016
LOC101882770
0.123
rpl5a
-0.015
ttc12
0.122
rps21
-0.015
si:dkey-22o22.2
0.120
ip6k2a
-0.015
si:dkey-237j10.2
0.110
s100w
-0.014
atp1b1b
0.107
selenok
-0.014
CR354430.4
0.106
ak2
-0.014
zgc:163083
0.102
mgst2
-0.014
anpepa
0.098
serf2
-0.014
si:ch73-359m17.9
0.098
si:dkey-74k8.3
-0.014
exoc3l2b
0.097
rnf185
-0.014
si:dkey-33i11.4
0.097
rpl10
-0.014
itgb3b
0.097
ahcy
-0.014
kcnj16
0.090
ywhabl
-0.013
lpar5a
0.090
ywhaba
-0.013
tbc1d2b
0.089
zgc:193505
-0.013
slc8a1a
0.088
elovl7a
-0.013
si:ch211-147m6.1
0.087
ANXA1 (1 of many)
-0.013
cxcr3.2
0.087
rps10
-0.013
gmfg
0.086
aldob
-0.013
zgc:66479
0.086
rpl35a
-0.013
atp1a1a.2
0.086
rpl26
-0.013