Daniocell
trappc9 (ionocytes / mucous-producing)
trafficking protein particle complex 9
ZFIN
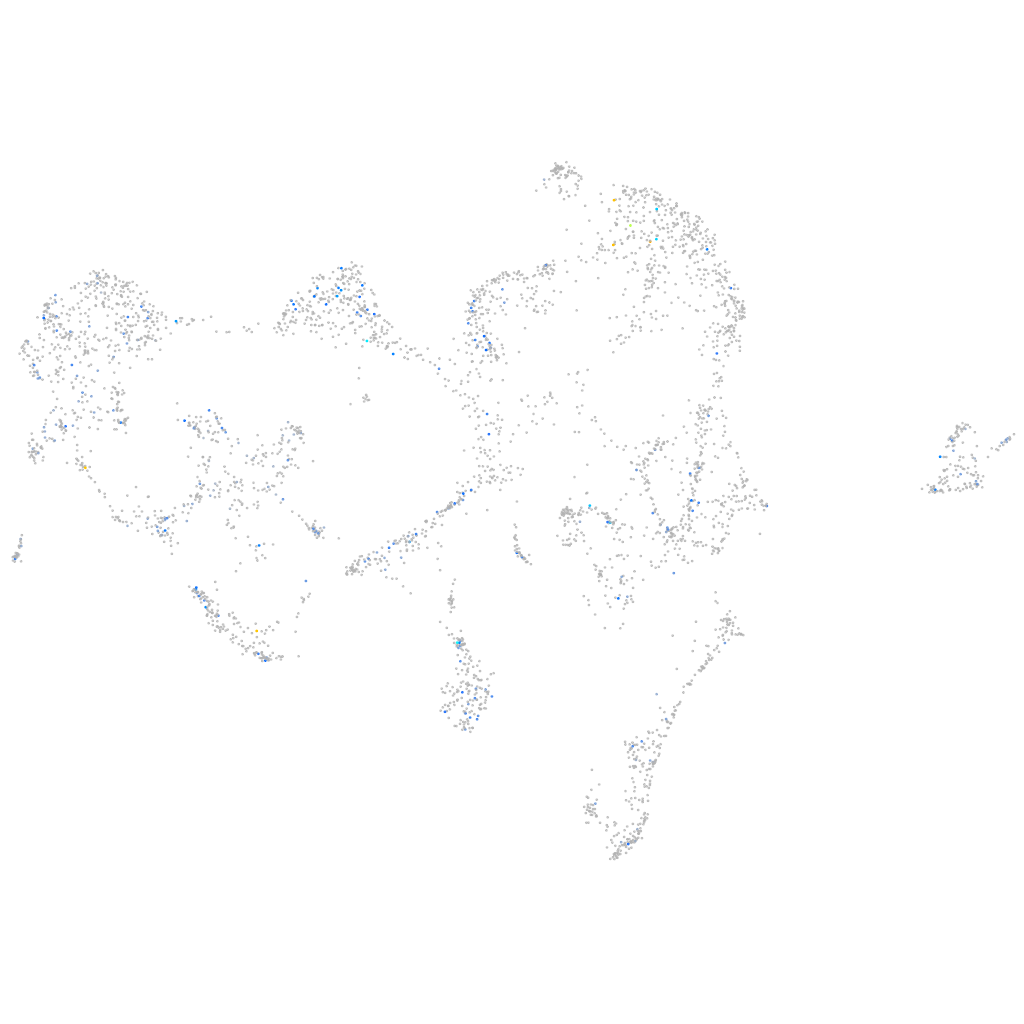
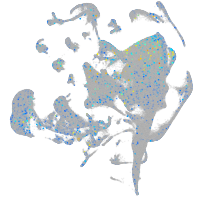
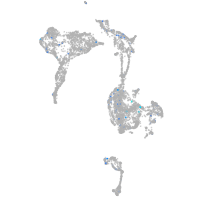
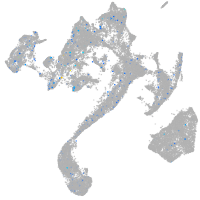
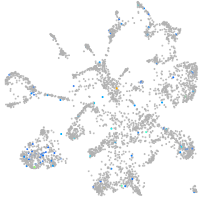
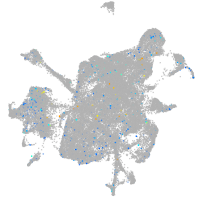
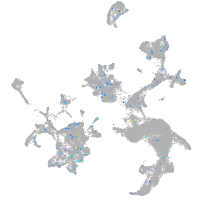
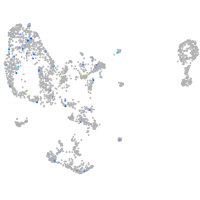
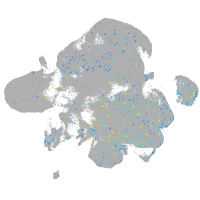
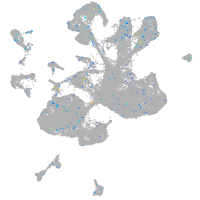
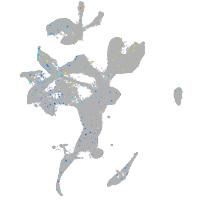
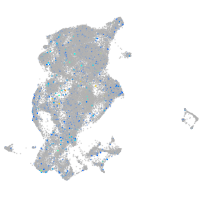
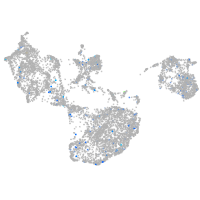
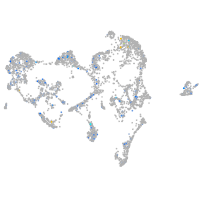
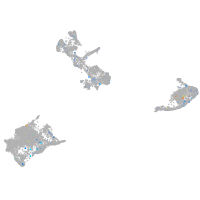
Gene expression UMAP
Display:
Expression
Stage
Other cell groups
all cells
blastomeres
PGCs
endoderm
axial mesoderm
muscle
mural cells /
non-skeletal muscle
mesenchyme
hematopoietic /
vasculature
pronephros
neural
spinal cord / glia
eye
taste / olfactory
otic / lateral line
epidermis
periderm
fin
ionocytes / mucous
pigment cells
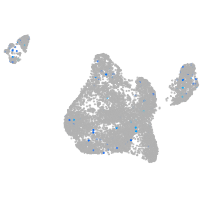
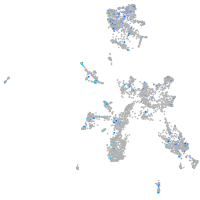
Expression by stage/cluster
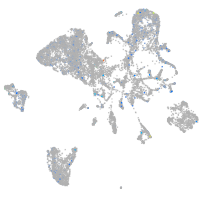
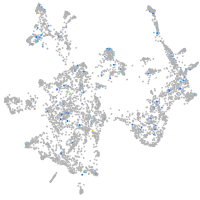
Correlated gene expression
Positive correlation
Negative correlation
Gene
r
Gene
r
abrab
0.242
ybx1
-0.085
si:dkey-26c10.5
0.225
rpl23
-0.078
XLOC-028010
0.219
rpl22
-0.076
ptcd2
0.201
rps27.1
-0.073
sv2ba
0.201
rps7
-0.072
si:dkey-22f5.9
0.191
rpl17
-0.068
tmem182a
0.189
rpl10a
-0.068
LOC101884896
0.188
rpl35
-0.064
wdyhv1
0.181
zgc:114188
-0.063
prelp
0.178
si:ch211-222l21.1
-0.063
CU929160.1
0.177
ptmaa
-0.062
entpd8
0.176
rps9
-0.062
fhod3a
0.170
ptmab
-0.062
si:dkey-40m6.8
0.162
nop56
-0.060
arhgef33
0.159
rps14
-0.060
LOC110438169
0.157
stmn1a
-0.059
si:ch211-288d18.1
0.150
eef1g
-0.058
trim35-19
0.149
rplp1
-0.058
cblb
0.144
hmgb2b
-0.056
rsph14
0.143
anp32b
-0.056
atp2b3b
0.141
eif3m
-0.055
LOC110438467
0.138
si:ch211-217k17.7
-0.055
LOC108181079
0.138
agr2
-0.054
zgc:101566
0.137
anxa5b
-0.054
si:dkey-88l16.5
0.136
fbl
-0.053
LOC101885494
0.135
faua
-0.052
si:ch1073-440b2.1
0.135
rps26
-0.052
ndst3
0.135
khsrp
-0.052
si:ch73-132k15.2
0.132
pcna
-0.052
LOC100004392
0.131
nop16
-0.052
zbtb12.1
0.131
cirbpa
-0.052
XLOC-013920
0.130
ppib
-0.052
CU104782.1
0.129
rpa3
-0.052
XLOC-042812
0.129
si:ch73-281n10.2
-0.052
gpr37l1b
0.126
sdc4
-0.051