Daniocell
tppp2 (endoderm)
tubulin polymerization-promoting protein family member 2
ZFIN
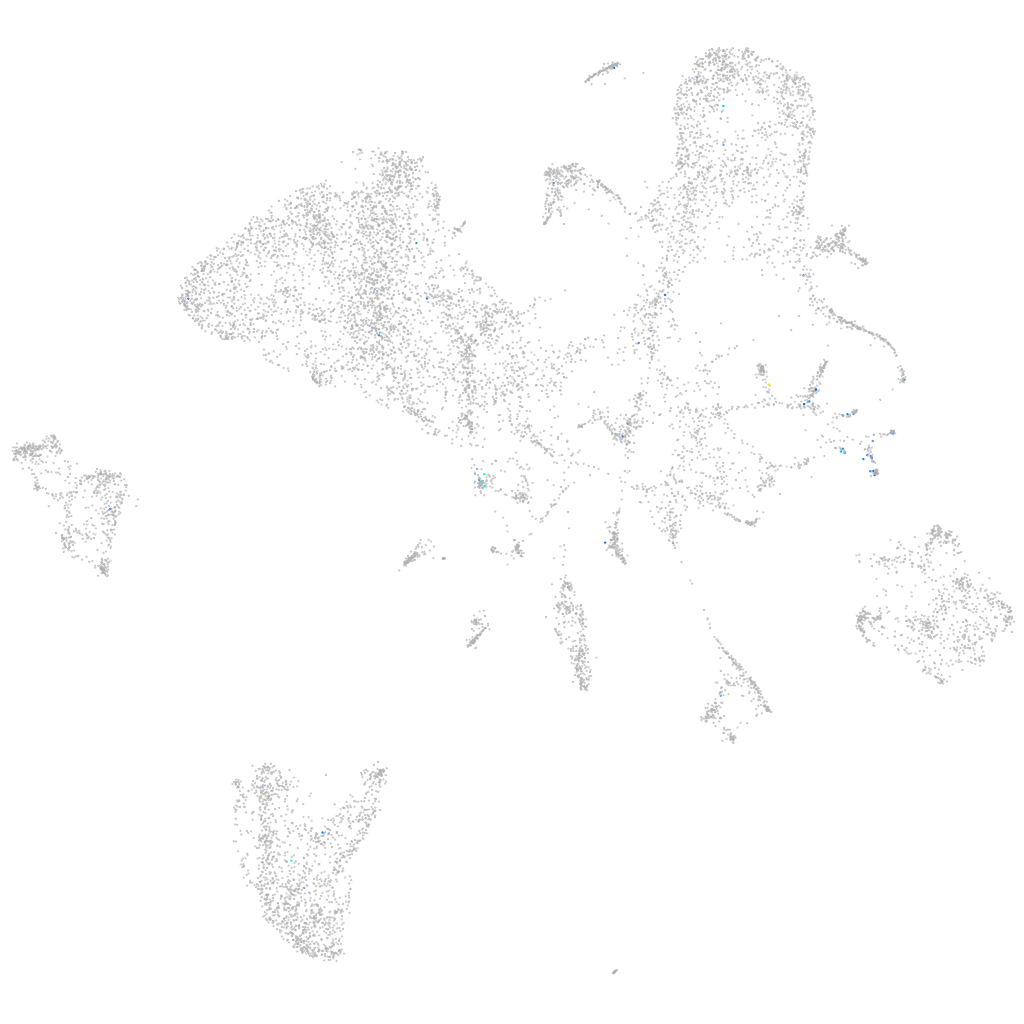
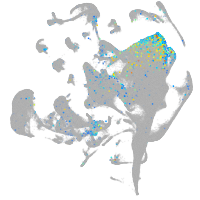
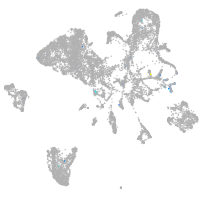
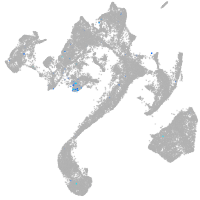
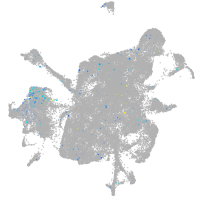
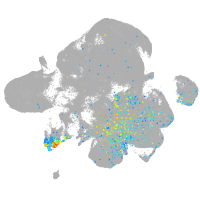
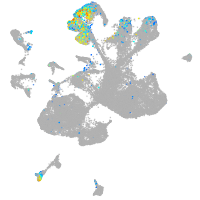
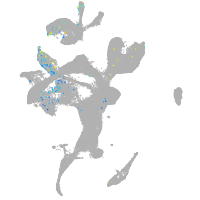
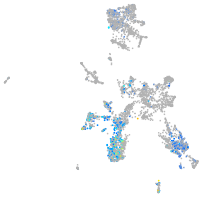
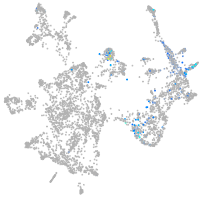
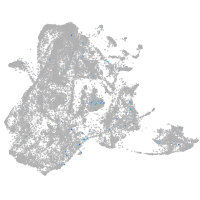
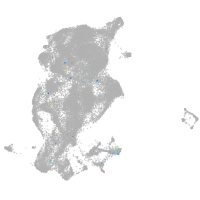
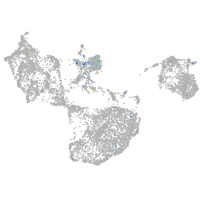
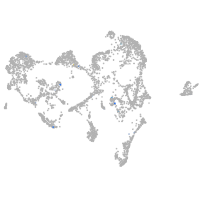
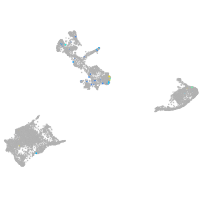
Gene expression UMAP
Display:
Expression
Stage
Other cell groups
all cells
blastomeres
PGCs
endoderm
axial mesoderm
muscle
mural cells /
non-skeletal muscle
mesenchyme
hematopoietic /
vasculature
pronephros
neural
spinal cord / glia
eye
taste / olfactory
otic / lateral line
epidermis
periderm
fin
ionocytes / mucous
pigment cells
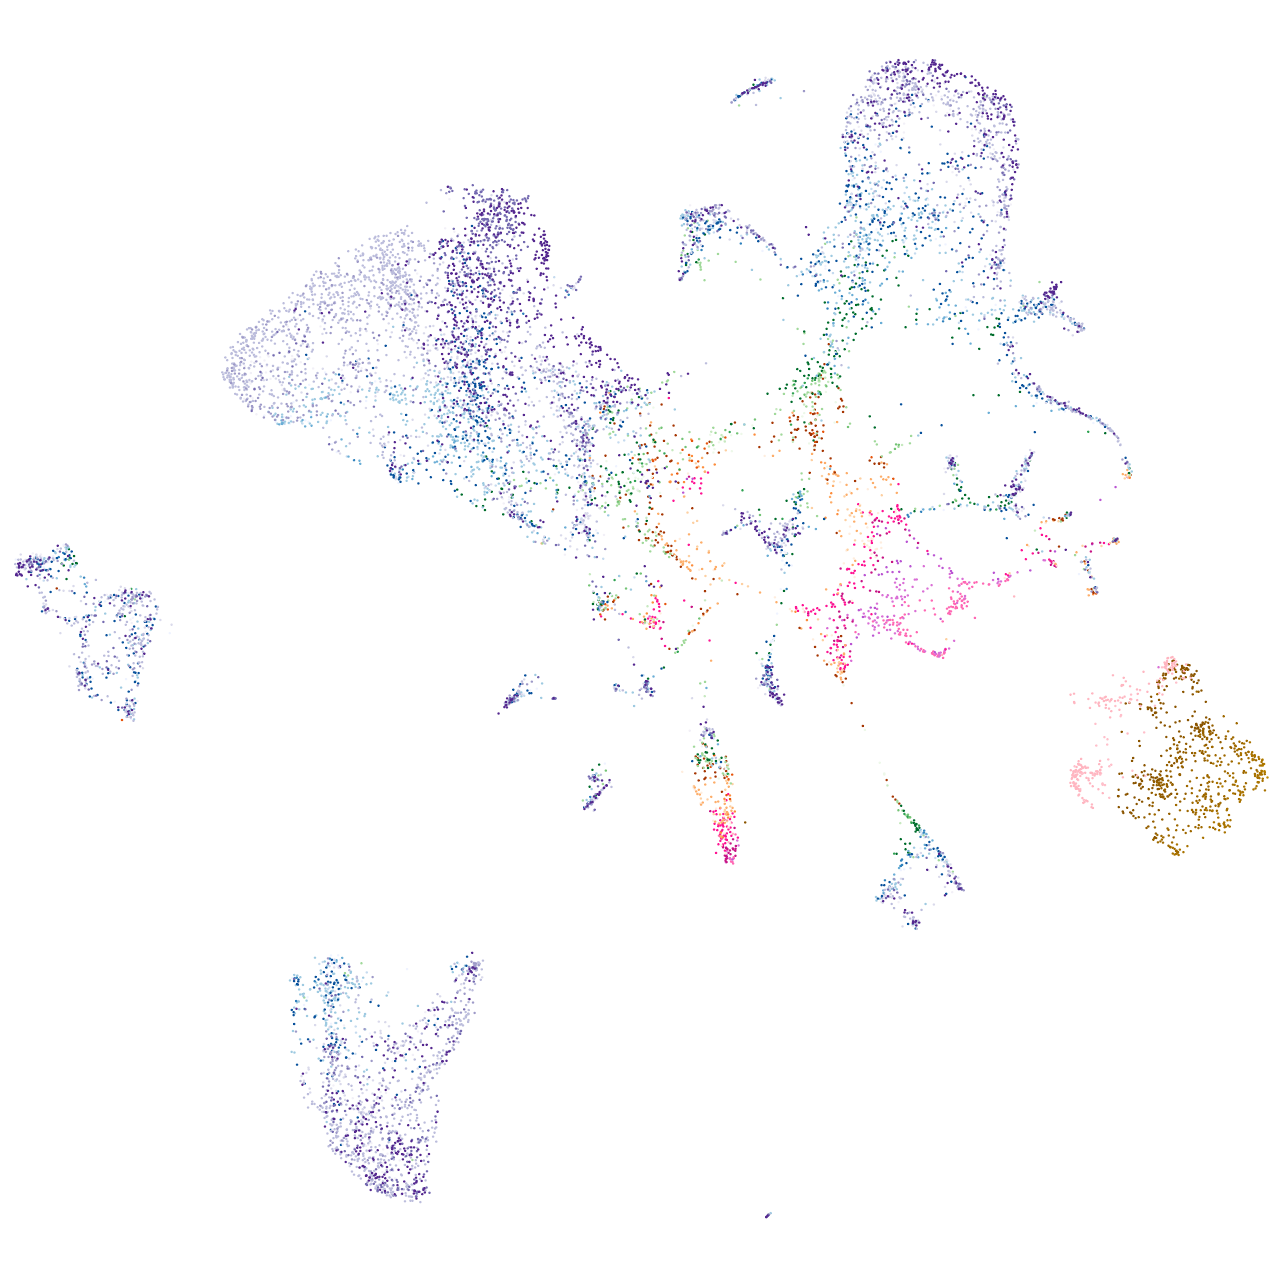
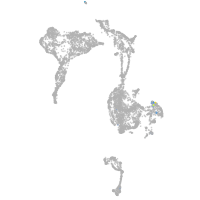
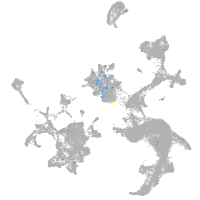
Expression by stage/cluster
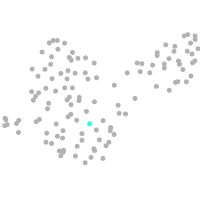
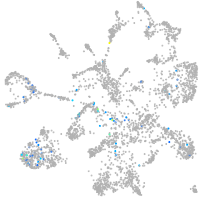
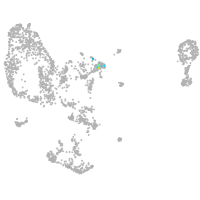
Correlated gene expression
Positive correlation
Negative correlation
Gene
r
Gene
r
cga
0.328
aldob
-0.046
tshr
0.318
rpl12
-0.045
si:dkey-27j5.5
0.297
ahcy
-0.042
CABZ01066921.1
0.295
gstr
-0.041
XLOC-004668
0.263
rps20
-0.040
il16
0.253
suclg2
-0.039
LOC110440219
0.252
shmt1
-0.039
si:ch211-151m7.6
0.236
rps6
-0.039
zgc:91999
0.229
cebpd
-0.038
si:ch211-57i17.5
0.226
dkc1
-0.038
six2b
0.226
aldh7a1
-0.038
bcan
0.223
nipsnap3a
-0.037
zmp:0000000755
0.217
tuba8l
-0.036
XLOC-008693
0.214
gstp1
-0.036
AL645792.1
0.211
mat1a
-0.036
LO018363.1
0.211
krt18a.1
-0.036
tnk2a
0.208
si:dkey-151g10.6
-0.036
zgc:194665
0.204
hdlbpa
-0.035
si:dkey-178e17.3
0.203
msrb2
-0.035
si:ch73-261i21.5
0.203
haao
-0.035
mapk10
0.198
eef1da
-0.034
kcnh2a
0.198
si:dkey-16p21.8
-0.034
LOC101887114
0.189
gapdh
-0.034
CR361551.1
0.189
eif4ebp3l
-0.034
si:dkey-27m7.4
0.188
ppa1b
-0.034
adam23a
0.187
suclg1
-0.033
ndufa4l2a
0.186
ckba
-0.033
st8sia5
0.185
eno3
-0.033
CU459065.1
0.184
slc25a34
-0.033
ak8
0.183
gstt1a
-0.033
kcnj11
0.182
rgn
-0.033
pcsk1nl
0.182
nupr1b
-0.033
syt14a
0.182
klf15
-0.033
GRM7
0.181
nme2b.1
-0.033
dmtn
0.180
slc16a1b
-0.033