Daniocell
tp53i11b (primordial germ cells)
tumor protein p53 inducible protein 11b
ZFIN
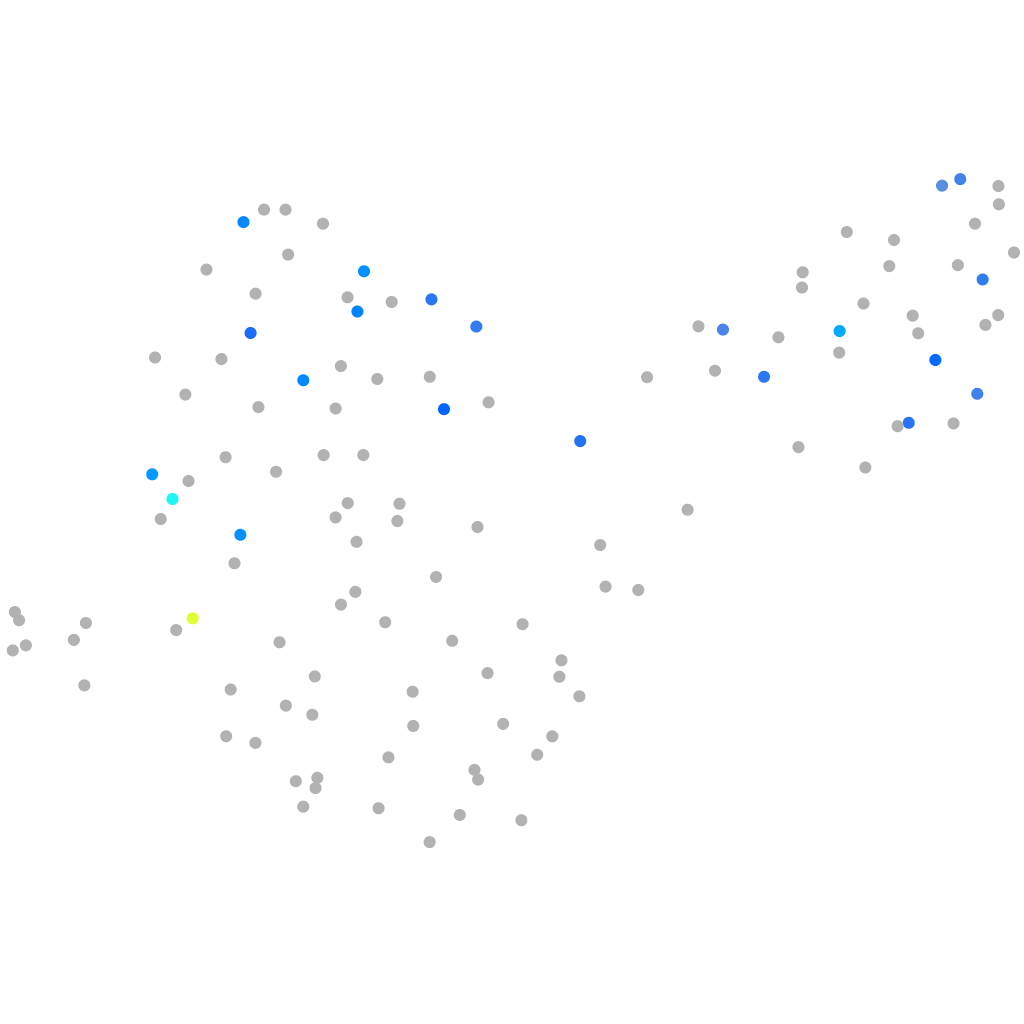
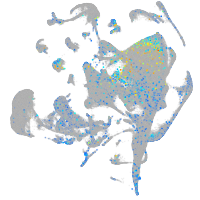
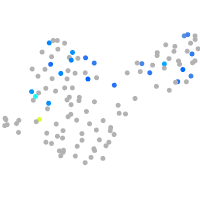
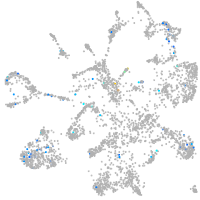
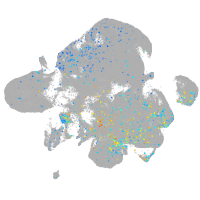
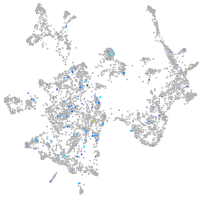
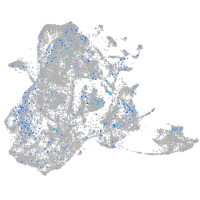
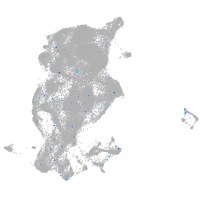
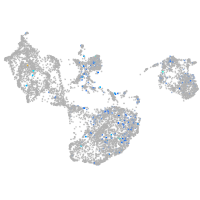
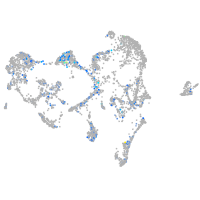
Gene expression UMAP
Display:
Expression
Stage
Other cell groups
all cells
blastomeres
PGCs
endoderm
axial mesoderm
muscle
mural cells /
non-skeletal muscle
mesenchyme
hematopoietic /
vasculature
pronephros
neural
spinal cord / glia
eye
taste / olfactory
otic / lateral line
epidermis
periderm
fin
ionocytes / mucous
pigment cells
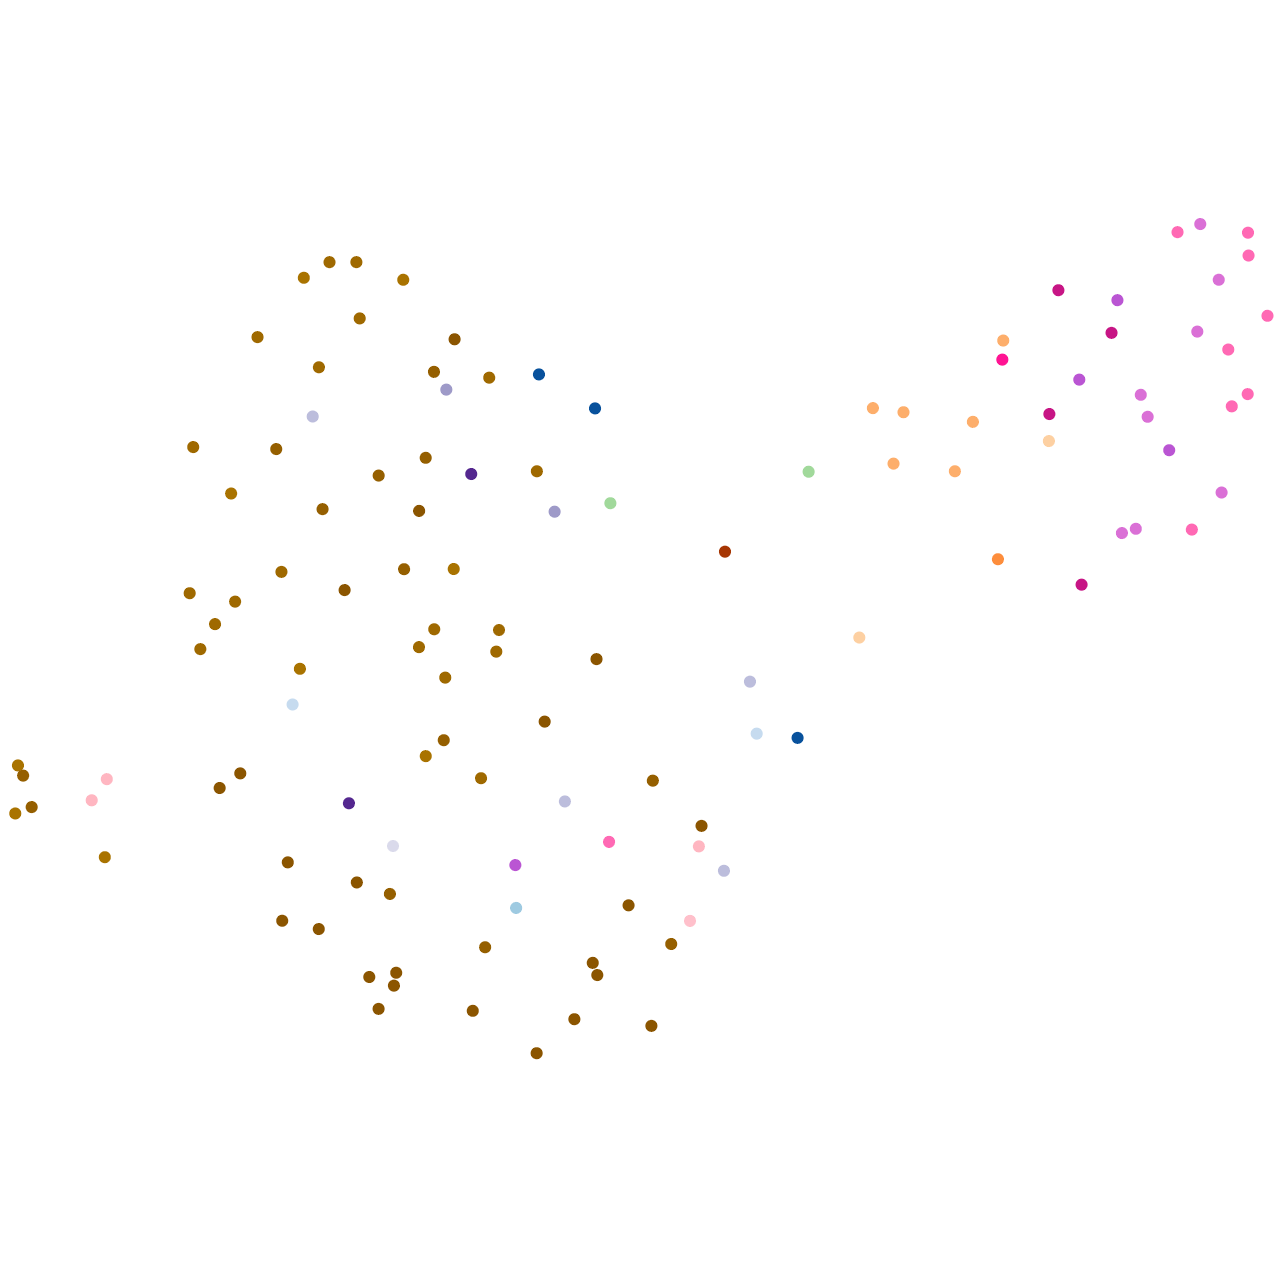
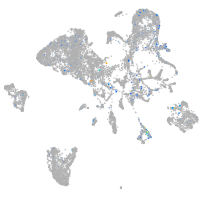
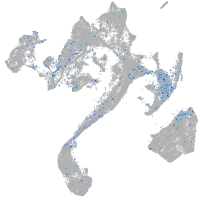
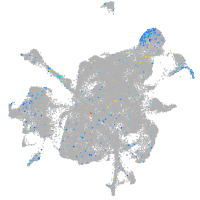
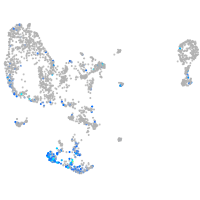
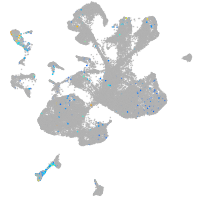
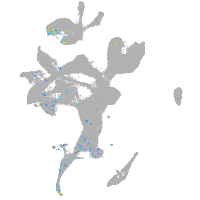
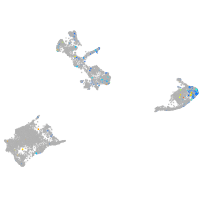
Expression by stage/cluster
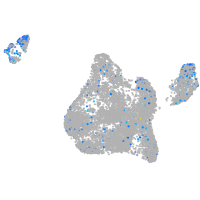
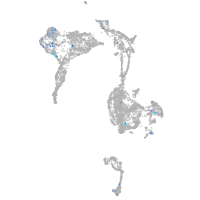
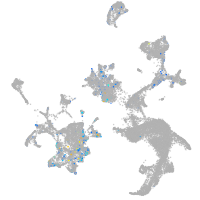
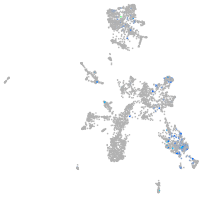
Correlated gene expression
Positive correlation
Negative correlation
Gene
r
Gene
r
gmpr2
0.489
pabpc1a
-0.263
tacc1
0.488
ss18
-0.260
wu:fi34b01
0.485
zgc:112356
-0.247
BX005461.2
0.478
hmgn6
-0.228
has3
0.478
si:ch73-281n10.2
-0.207
LOC101886786
0.478
phpt1
-0.205
tinf2
0.475
otud5b
-0.202
sumo2a
0.473
si:ch211-51e12.7
-0.198
gulp1a
0.473
btg2
-0.193
XLOC-032256
0.468
si:dkey-48p11.3
-0.187
ube2al
0.453
jpt2
-0.187
idh3g
0.451
golga7
-0.187
slc34a2b
0.447
histh1l
-0.186
dph2
0.447
ucp2
-0.186
dnajb5
0.445
fosab
-0.186
LOC108182857
0.444
ptmab
-0.185
si:dkey-269o24.6
0.443
memo1
-0.181
hist1h2a5
0.442
pip4p1a
-0.179
LOC110437839
0.441
RSBN1
-0.174
si:dkey-68o6.6
0.440
rbm25b
-0.172
si:ch73-109d9.3
0.435
styx
-0.170
si:dkeyp-121d2.7
0.434
ptges3b
-0.170
kiaa1958
0.431
mcrip1
-0.170
znf296
0.427
actb2
-0.168
znf800b
0.422
pagr1
-0.168
lyn
0.422
si:ch211-133n4.4
-0.167
thoc1
0.417
gtf3c3
-0.165
camsap2b
0.395
kctd5a
-0.165
BX539310.1
0.394
usf2
-0.164
cdk14
0.394
maf1
-0.163
eps8l3b
0.394
atp2b1a
-0.163
LOC100537936
0.394
eif2b4
-0.162
LOC108179246
0.394
dnaja2a
-0.161
nudt4b
0.394
zgc:103697
-0.161
si:dkey-51d8.1
0.394
ppp1r3b
-0.161