Daniocell
tox4b (mesenchyme)
TOX high mobility group box family member 4 b
ZFIN
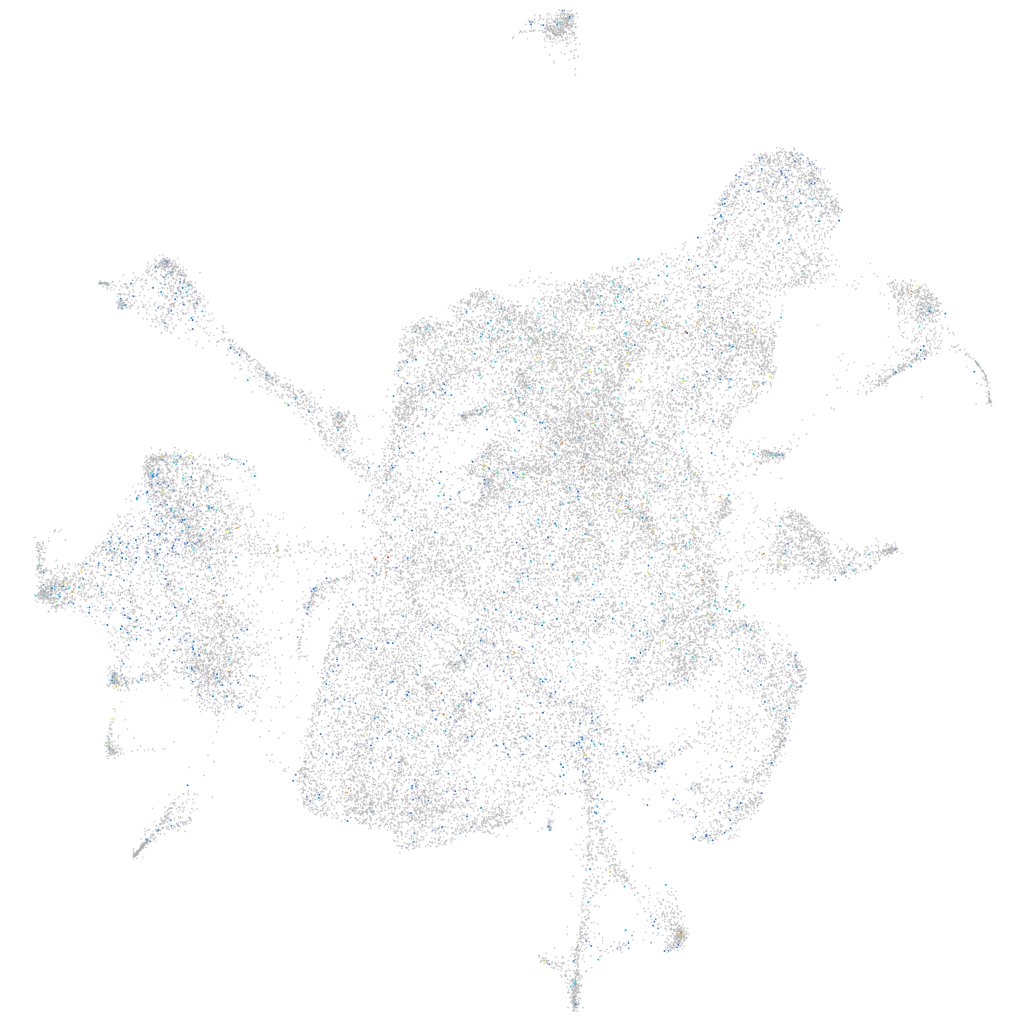
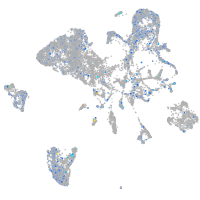
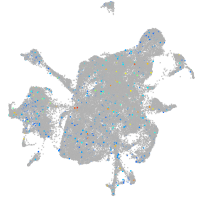
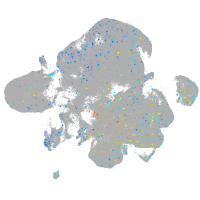
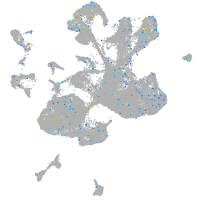
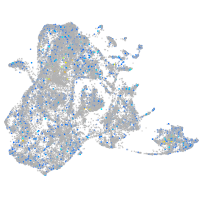
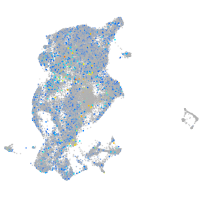
Gene expression UMAP
Display:
Expression
Stage
Other cell groups
all cells
blastomeres
PGCs
endoderm
axial mesoderm
muscle
mural cells /
non-skeletal muscle
mesenchyme
hematopoietic /
vasculature
pronephros
neural
spinal cord / glia
eye
taste / olfactory
otic / lateral line
epidermis
periderm
fin
ionocytes / mucous
pigment cells
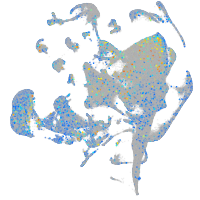
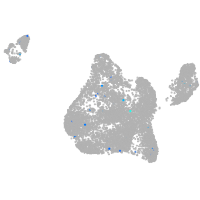
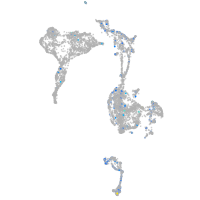
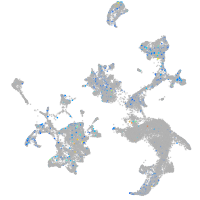
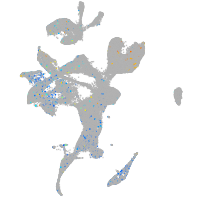
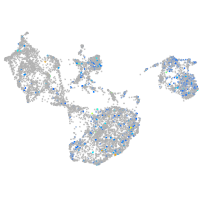
Expression by stage/cluster
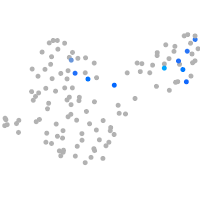
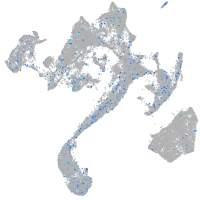
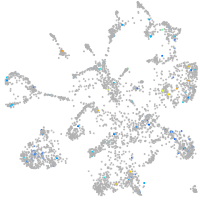
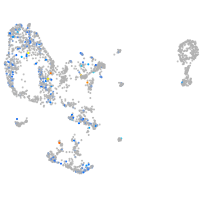
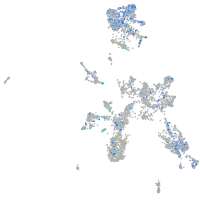
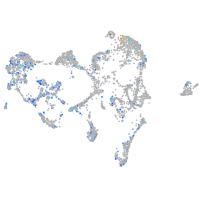
Correlated gene expression
Positive correlation
Negative correlation
Gene
r
Gene
r
LOC110438253
0.078
rpl39
-0.034
si:dkey-13e3.1
0.074
si:dkey-151g10.6
-0.034
CR382294.1
0.070
rplp1
-0.030
LOC110439391
0.068
rps20
-0.029
taar16a
0.062
rpl37
-0.027
AL954142.2
0.060
rpl13a
-0.027
LOC101886621
0.059
rps24
-0.027
LOC108181885
0.057
rps28
-0.025
CT027609.1
0.057
rps23
-0.025
LOC101886244
0.056
rplp2l
-0.025
taar20o
0.056
rpl36a
-0.025
CABZ01078606.1
0.055
rpl29
-0.025
tex26
0.054
rpl36
-0.024
BX284697.2
0.052
rps26
-0.023
LOC100536629
0.049
rps29
-0.023
LOC103909988
0.049
rps13
-0.023
si:ch211-45c16.2
0.048
rpl18a
-0.022
XLOC-000339
0.048
rpl17
-0.022
si:dkey-219e21.4
0.048
rpl35a
-0.022
zgc:112408
0.048
rpl7
-0.022
micall2a
0.047
rpl10
-0.021
crfb15
0.046
rpl38
-0.021
BX005108.2
0.046
cdc20
-0.021
CR769778.1
0.046
rps21
-0.021
noxa1
0.045
rps12
-0.020
gpm6aa
0.044
rplp0
-0.020
dvl1a
0.043
rps5
-0.020
zte38
0.043
ube2c
-0.020
MYO1G
0.043
rps8a
-0.019
SLC5A7
0.042
rps9
-0.019
si:cabz01069582.1
0.042
rps15
-0.019
si:ch211-107e6.6
0.042
rpl9
-0.019
FO393424.1
0.042
rpl30
-0.019
rasip1
0.041
rpl7a
-0.018
cacna1da
0.041
faua
-0.018