Daniocell
tnni1d (mesenchyme)
"troponin I, skeletal, slow d"
ZFIN
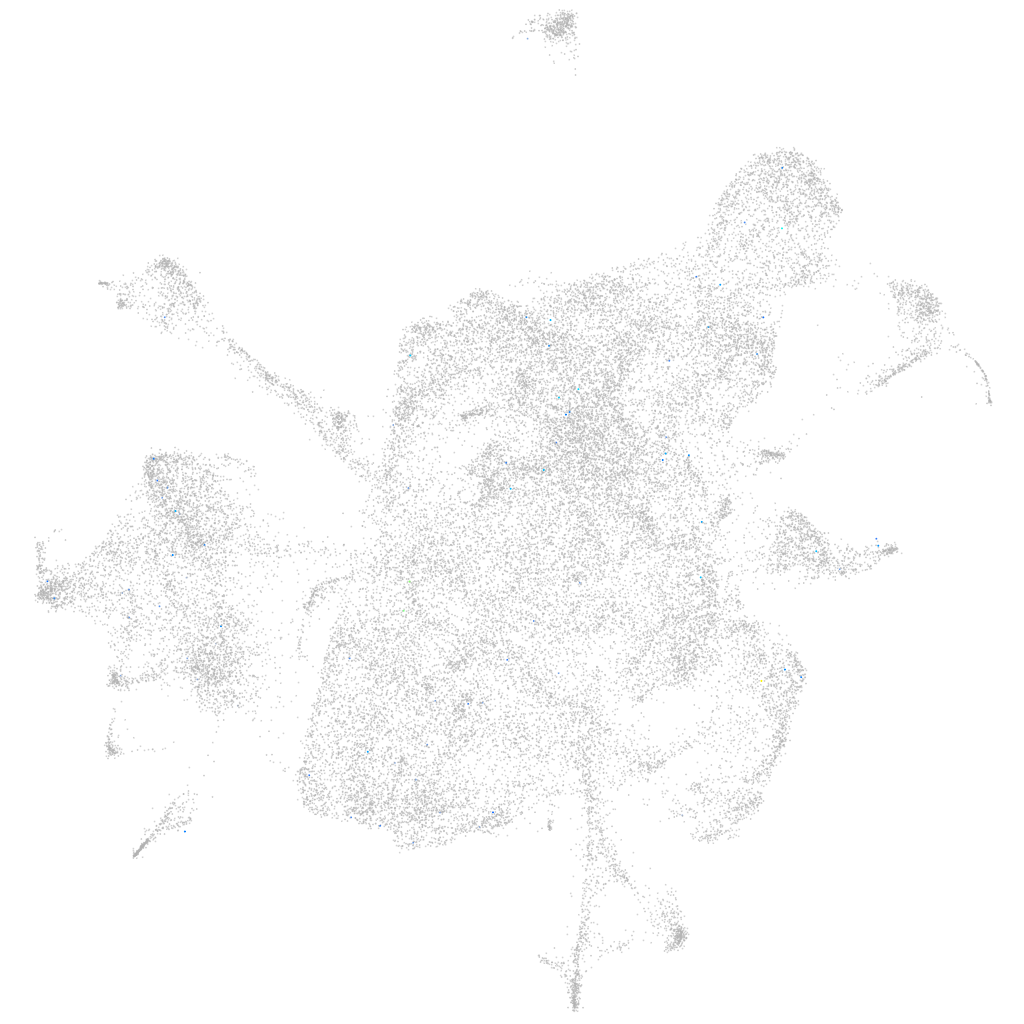
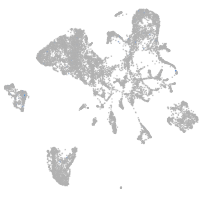
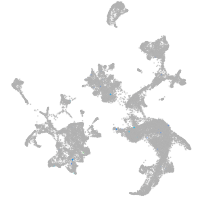
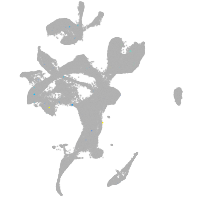
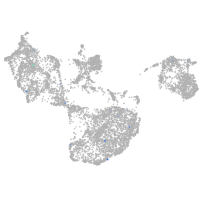
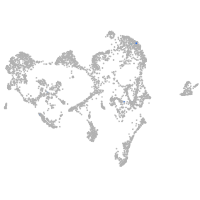
Gene expression UMAP
Display:
Expression
Stage
Other cell groups
all cells
blastomeres
PGCs
endoderm
axial mesoderm
muscle
mural cells /
non-skeletal muscle
mesenchyme
hematopoietic /
vasculature
pronephros
neural
spinal cord / glia
eye
taste / olfactory
otic / lateral line
epidermis
periderm
fin
ionocytes / mucous
pigment cells
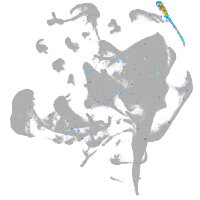
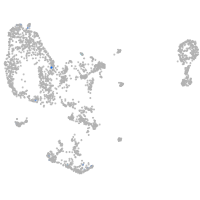
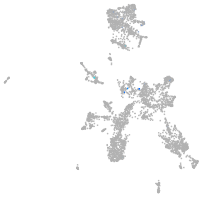
Expression by stage/cluster
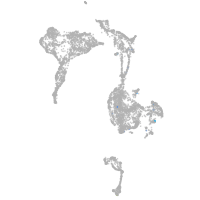
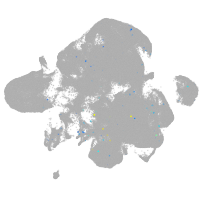
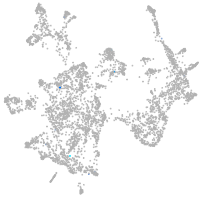
Correlated gene expression
Positive correlation
Negative correlation
Gene
r
Gene
r
XLOC-005660
0.140
rpl27
-0.019
rln3b
0.131
ap1s2
-0.014
CT573006.2
0.128
mrpl2
-0.013
LOC108181419
0.125
prkab1b
-0.013
si:ch211-260p9.3
0.117
atp5fa1
-0.012
RF01299
0.087
gas1a
-0.012
XLOC-015228
0.086
arf2b
-0.012
AL935295.2
0.076
snrnp27
-0.012
LOC101883959
0.074
mrps25
-0.012
XLOC-033953
0.074
nedd8l
-0.012
si:busm1-266f07.2
0.074
si:ch211-235e9.6
-0.012
LOC101885626
0.072
ndufa10
-0.012
BX323586.3
0.066
COX7A2 (1 of many)
-0.011
si:dkey-13m1.5
0.064
alyref
-0.011
LOC101885065
0.064
psmb4
-0.011
strip2
0.064
rnf40
-0.011
CR925797.1
0.063
rabif
-0.011
vimr1
0.060
zgc:86598
-0.011
AL954682.1
0.059
usf1l
-0.011
zgc:112965
0.058
cct8
-0.011
drd7
0.055
hgs
-0.011
acyp2
0.055
srsf7a
-0.011
si:ch211-221f10.2
0.054
ncor1
-0.011
LOC101886133
0.054
tcf3b
-0.011
si:rp71-1i20.1
0.053
kdelr2b
-0.011
LOC110439595
0.053
arpc4l
-0.011
ncf2
0.051
calr3b
-0.010
si:ch211-202h22.8
0.051
nme3
-0.010
si:dkey-63d15.12
0.051
cops8
-0.010
mfsd4ab
0.051
sub1a
-0.010
gsto1
0.050
rac1a
-0.010
alkal1
0.050
CU694197.1
-0.010
cbln9
0.048
ccdc47
-0.010
tmem170b
0.048
inip
-0.010
XLOC-024231
0.046
copa
-0.010