Daniocell
tmtc4 (blastomeres)
transmembrane O-mannosyltransferase targeting cadherins 4
ZFIN
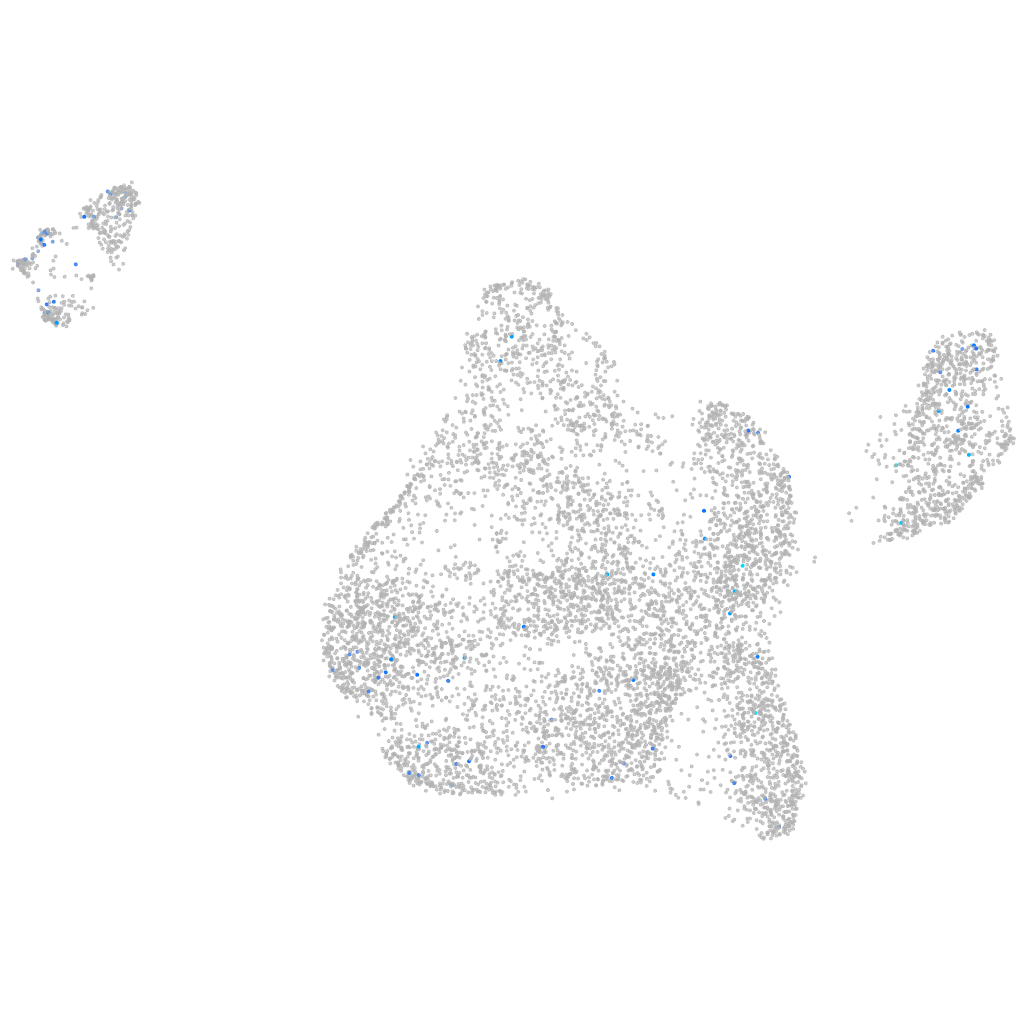
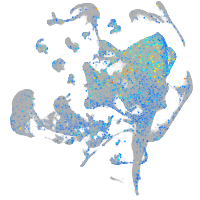
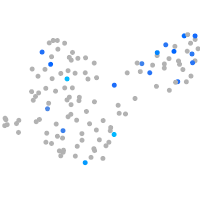
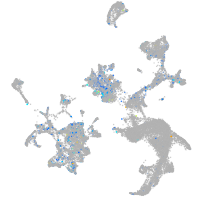
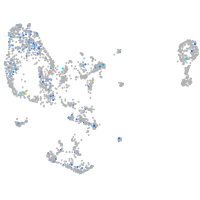
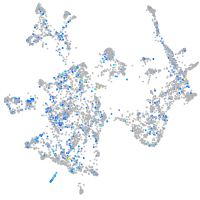
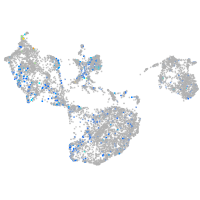
Gene expression UMAP
Display:
Expression
Stage
Other cell groups
all cells
blastomeres
PGCs
endoderm
axial mesoderm
muscle
mural cells /
non-skeletal muscle
mesenchyme
hematopoietic /
vasculature
pronephros
neural
spinal cord / glia
eye
taste / olfactory
otic / lateral line
epidermis
periderm
fin
ionocytes / mucous
pigment cells
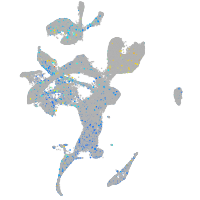
Expression by stage/cluster
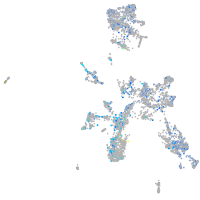
Correlated gene expression
Positive correlation
Negative correlation
Gene
r
Gene
r
adgre17
0.175
si:ch73-1a9.3
-0.081
si:dkeyp-80d11.10
0.161
marcksl1b
-0.077
kcnj9
0.150
si:ch211-222l21.1
-0.071
si:dkey-96f10.1
0.147
hspb1
-0.065
BX470247.1
0.139
hmga1a
-0.064
si:dkey-11e23.9
0.136
hnrnpa0b
-0.064
si:dkey-238o14.1
0.131
stm
-0.062
scpp9
0.130
dynll1
-0.060
mxb
0.118
rpl7a
-0.059
si:dkey-190g11.3
0.113
hmgb2a
-0.059
LOC103911458
0.112
apoeb
-0.058
CABZ01085662.1
0.111
ptmab
-0.057
creb5a
0.110
hmgn6
-0.057
LOC103910295
0.109
rps6
-0.056
TULP1
0.107
rpl32
-0.056
bsnd
0.103
snrpf
-0.056
si:dkey-7f16.3
0.103
hmgb2b
-0.056
icn2
0.103
rpl36
-0.055
si:ch211-197l9.2
0.100
rpl15
-0.055
scpp7
0.100
rps19
-0.055
si:ch211-212c13.10
0.099
cirbpb
-0.054
CR533430.1
0.098
aldob
-0.054
cygb1
0.092
si:ch211-152c2.3
-0.053
usp43a
0.092
npm1a
-0.053
zgc:153913
0.092
rpl13
-0.053
XLOC-042210
0.091
si:dkey-151g10.6
-0.052
si:dkey-7e14.3
0.090
eef1a1l1
-0.052
arl4ca
0.090
rpl7
-0.052
si:ch211-147a11.3
0.089
polr3gla
-0.051
si:ch73-223p23.2
0.089
rpsa
-0.051
si:ch211-107e6.6
0.089
rps2
-0.051
si:dkey-126g1.7
0.089
ved
-0.050
mitfb
0.089
tp53inp2
-0.048
MDFI
0.088
rplp1
-0.048
lingo4a
0.088
snrpd1
-0.048