Daniocell
tmf1 (mural cells / non-skeletal muscle)
TATA element modulatory factor 1
ZFIN
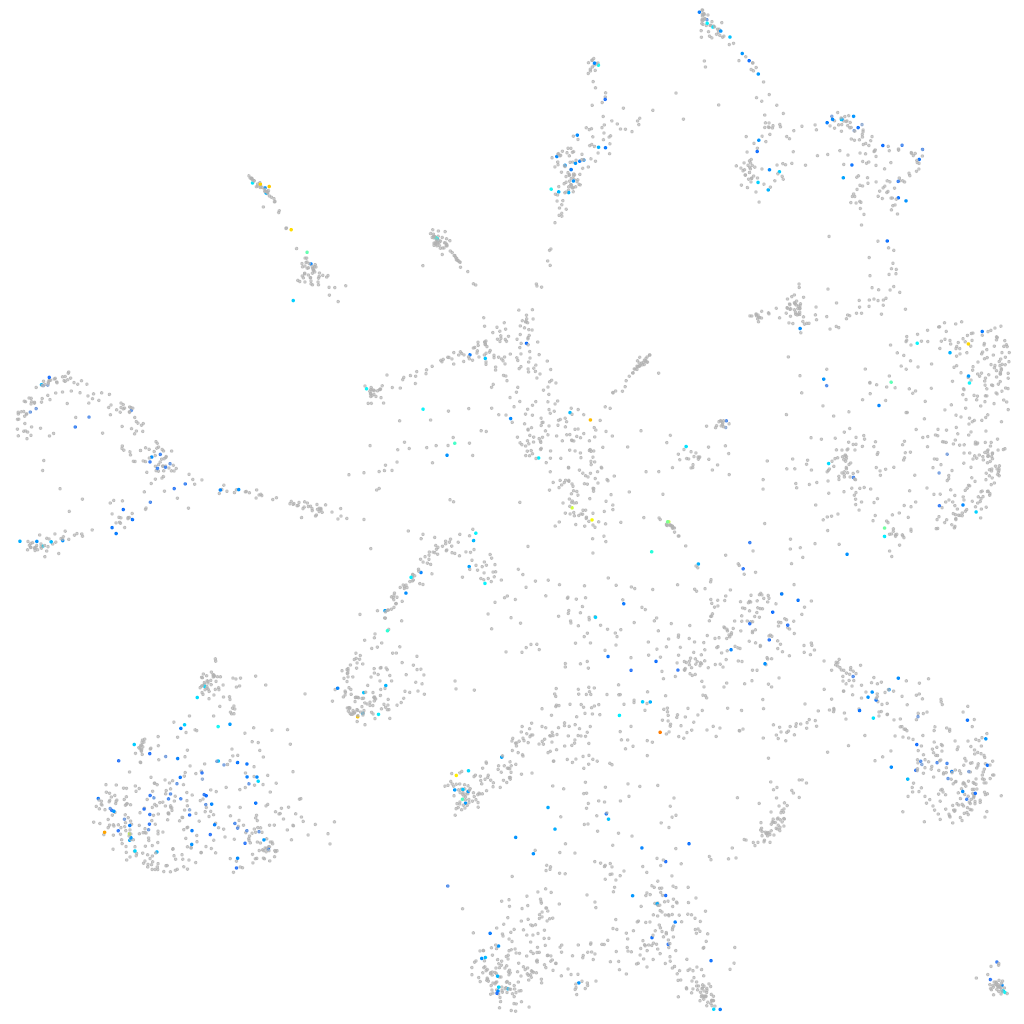
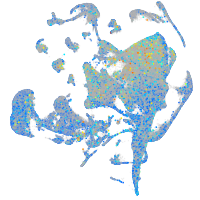
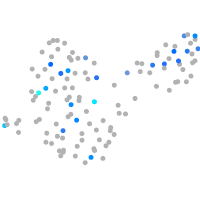
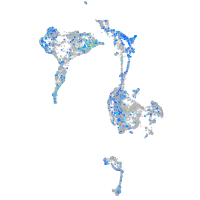
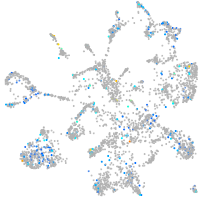
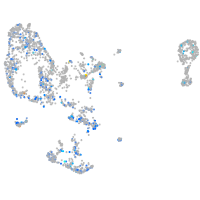
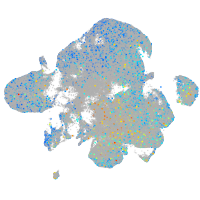
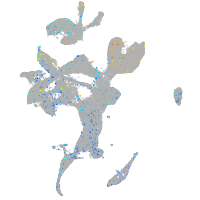
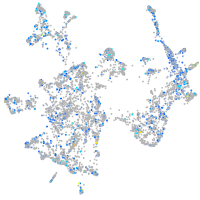
Gene expression UMAP
Display:
Expression
Stage
Other cell groups
all cells
blastomeres
PGCs
endoderm
axial mesoderm
muscle
mural cells /
non-skeletal muscle
mesenchyme
hematopoietic /
vasculature
pronephros
neural
spinal cord / glia
eye
taste / olfactory
otic / lateral line
epidermis
periderm
fin
ionocytes / mucous
pigment cells
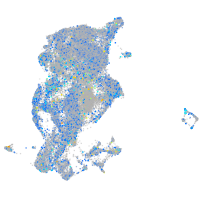
Expression by stage/cluster
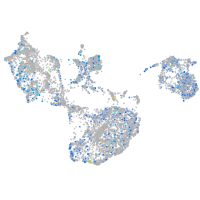
Correlated gene expression
Positive correlation
Negative correlation
Gene
r
Gene
r
cdh27
0.133
aoc2
-0.055
LOC110438122
0.131
rbp4
-0.048
LOC101885538
0.127
tagln2
-0.043
si:ch211-191c10.3
0.126
rpl36
-0.043
sybu
0.126
XLOC-025423
-0.042
sntg2
0.124
rps28
-0.042
LOC101885129
0.123
rpl36a
-0.042
CR388184.1
0.121
itpk1b
-0.042
b3glctb
0.120
rpl38
-0.041
asphd1
0.119
aqp8a.1
-0.040
CR855996.2
0.117
rhag
-0.040
LOC108179500
0.116
zgc:158463
-0.039
mxc
0.116
rplp1
-0.039
si:dkey-22p6.2
0.115
fabp10a
-0.039
RNF14 (1 of many)
0.112
XLOC-028370
-0.039
zgc:172182
0.111
rpl37
-0.039
FP326652.1
0.111
myrf
-0.039
CU639397.1
0.110
ifitm1
-0.038
cyp2p9
0.110
lxn
-0.038
tbc1d20
0.109
BX323087.1
-0.038
si:ch73-233f7.3
0.108
plekhh1
-0.037
pimr184
0.108
tinagl1
-0.037
LOC101884710
0.107
rps29
-0.037
si:ch211-264f5.8
0.106
XLOC-041870
-0.036
tbx22
0.104
cyt1
-0.036
ft1
0.104
rpl29
-0.035
si:dkey-79i2.4
0.104
tp63
-0.035
BX511246.1
0.103
nt5e
-0.035
lins1
0.103
gps1
-0.035
BX901962.2
0.102
HACD4
-0.035
shisa9b
0.102
actr2a
-0.034
si:dkey-203a12.2
0.101
apoc1
-0.034
BX072561.1
0.101
CU914776.1
-0.034
FO704648.2
0.101
tmsb1
-0.034
LOC101883465
0.101
itga1
-0.034