Daniocell
tmem18 (blastomeres)
transmembrane protein 18
ZFIN
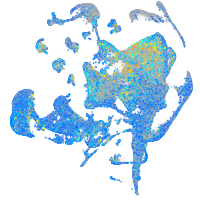
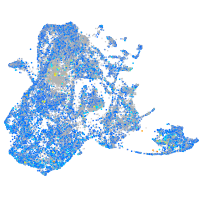
Gene expression UMAP
Display:
Expression
Stage
Other cell groups
all cells
blastomeres
PGCs
endoderm
axial mesoderm
muscle
mural cells /
non-skeletal muscle
mesenchyme
hematopoietic /
vasculature
pronephros
neural
spinal cord / glia
eye
taste / olfactory
otic / lateral line
epidermis
periderm
fin
ionocytes / mucous
pigment cells
Expression by stage/cluster
Correlated gene expression
Positive correlation
Negative correlation
Gene
r
Gene
r
eif3bb
0.064
NC-002333.4
-0.077
CR382327.2
0.063
capn2l
-0.033
FP236157.3
0.062
me3
-0.032
polr2c
0.060
sdf4
-0.031
LOC103911264
0.058
apoda.2
-0.031
gsg1l2a
0.056
znf1025
-0.031
si:ch211-92l17.1
0.055
si:dkey-79d12.5
-0.030
BX927081.1
0.054
ube2d4
-0.030
CU896647.1
0.054
wrn
-0.029
eef1a1l1
0.054
si:dkey-74k8.4
-0.029
snrpg
0.053
ankib1a
-0.029
LO018598.1
0.052
thrap3a
-0.028
FADS6
0.052
cdc25b
-0.028
lrrc4bb
0.052
BX927327.1
-0.028
slc7a3a
0.051
zgc:193711
-0.028
pgrmc2
0.051
zcchc7
-0.028
anapc10
0.050
usp46
-0.028
npm3
0.050
spg7
-0.028
gtpbp4
0.049
XLOC-017111
-0.028
LOC101882555
0.049
CR388373.2
-0.028
slco1d1
0.049
tead3b
-0.028
tpt1
0.049
map2k7
-0.027
rpl32
0.049
LOC110438496
-0.027
gabpa
0.049
ei24
-0.027
LOC110439968
0.049
CU914760.1
-0.027
BX005367.1
0.049
zgc:110329
-0.027
AL954322.3
0.049
tmsb5
-0.027
LOC108180171
0.048
ids
-0.026
LOC110438363
0.048
si:dkey-9c18.3
-0.026
atp8b4
0.048
usp48
-0.026
polr2h
0.048
uso1
-0.026
si:dkey-23o4.6
0.048
kptn
-0.026
klhl14
0.048
eomesa
-0.026
tacr1a
0.048
CR759841.1
-0.026
LOC108182486
0.048
si:dkey-287g12.6
-0.026